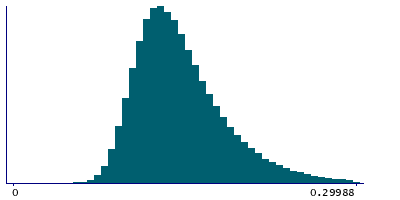
Data
507,960 items of data are available, covering 488,512 participants.
Defined-instances run from 0 to 1, labelled using Instancing
2.
Units of measurement are mmol/l.
| Maximum | 0.913401 |
| Decile 9 | 0.20456 |
| Decile 8 | 0.178503 |
| Decile 7 | 0.162715 |
| Decile 6 | 0.15106 |
| Median | 0.141322 |
| Decile 4 | 0.132619 |
| Decile 3 | 0.12419 |
| Decile 2 | 0.115299 |
| Decile 1 | 0.104296 |
| Minimum | 0.0074496 |
|
|
- Mean = 0.14935
- Std.dev = 0.0428483
- 3268 items above graph maximum of 0.304824
|
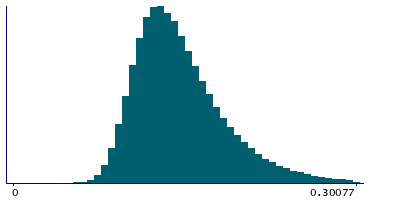
2 Instances
Instance 0 : Initial assessment visit (2006-2010) at which participants were recruited and consent given
488,083 participants, 488,083 items
| Maximum | 0.913401 |
| Decile 9 | 0.20492 |
| Decile 8 | 0.178761 |
| Decile 7 | 0.162869 |
| Decile 6 | 0.151144 |
| Median | 0.14135 |
| Decile 4 | 0.132604 |
| Decile 3 | 0.12416 |
| Decile 2 | 0.115239 |
| Decile 1 | 0.10423 |
| Minimum | 0.0074496 |
|
|
- Mean = 0.149452
- Std.dev = 0.0430415
- 3141 items above graph maximum of 0.305611
|
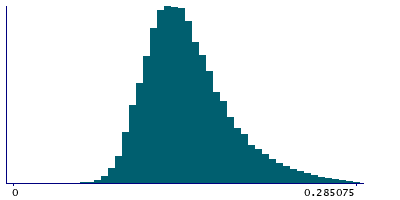
Instance 1 : First repeat assessment visit (2012-13)
19,877 participants, 19,877 items
| Maximum | 0.576534 |
| Decile 9 | 0.195575 |
| Decile 8 | 0.17301 |
| Decile 7 | 0.159355 |
| Decile 6 | 0.149064 |
| Median | 0.14072 |
| Decile 4 | 0.13289 |
| Decile 3 | 0.125043 |
| Decile 2 | 0.116738 |
| Decile 1 | 0.10585 |
| Minimum | 0.051762 |
|
|
- Mean = 0.146839
- Std.dev = 0.0377085
- 106 items above graph maximum of 0.2853
|


