Data
507,961 items of data are available, covering 488,513 participants.
Defined-instances run from 0 to 1, labelled using Instancing
2.
Units of measurement are mmol/l.
| Maximum | 4.42713 |
| Decile 9 | 1.79983 |
| Decile 8 | 1.61103 |
| Decile 7 | 1.48357 |
| Decile 6 | 1.38195 |
| Median | 1.2937 |
| Decile 4 | 1.2126 |
| Decile 3 | 1.1338 |
| Decile 2 | 1.0519 |
| Decile 1 | 0.952949 |
| Minimum | 0.0671389 |
|
|
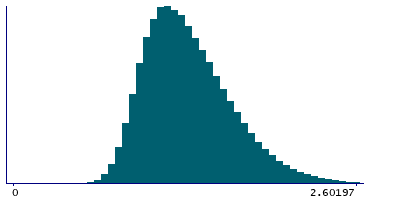
- Mean = 1.34194
- Std.dev = 0.337454
- 848 items above graph maximum of 2.6467
|
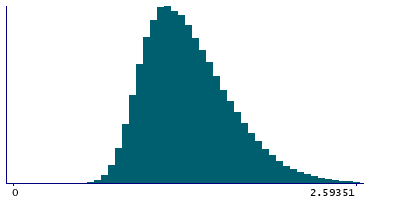
2 Instances
Instance 0 : Initial assessment visit (2006-2010) at which participants were recruited and consent given
488,084 participants, 488,084 items
| Maximum | 4.42713 |
| Decile 9 | 1.7971 |
| Decile 8 | 1.6086 |
| Decile 7 | 1.48132 |
| Decile 6 | 1.3799 |
| Median | 1.2919 |
| Decile 4 | 1.2108 |
| Decile 3 | 1.1324 |
| Decile 2 | 1.0506 |
| Decile 1 | 0.951912 |
| Minimum | 0.0671389 |
|
|
- Mean = 1.34014
- Std.dev = 0.336876
- 820 items above graph maximum of 2.64229
|
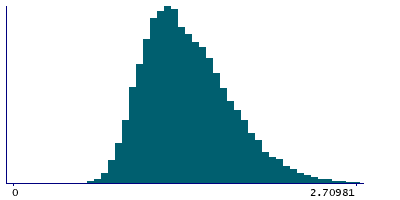
Instance 1 : First repeat assessment visit (2012-13)
19,877 participants, 19,877 items
| Maximum | 4.0091 |
| Decile 9 | 1.8537 |
| Decile 8 | 1.66721 |
| Decile 7 | 1.5385 |
| Decile 6 | 1.43445 |
| Median | 1.33999 |
| Decile 4 | 1.25285 |
| Decile 3 | 1.1699 |
| Decile 2 | 1.08505 |
| Decile 1 | 0.979346 |
| Minimum | 0.45511 |
|
|
- Mean = 1.38629
- Std.dev = 0.348429
- 31 items above graph maximum of 2.72805
|


