Data
507,960 items of data are available, covering 488,512 participants.
Defined-instances run from 0 to 1, labelled using Instancing
2.
Units of measurement are mmol/l.
| Maximum | 5.36537 |
| Decile 9 | 2.131 |
| Decile 8 | 1.92064 |
| Decile 7 | 1.77639 |
| Decile 6 | 1.6573 |
| Median | 1.54897 |
| Decile 4 | 1.4436 |
| Decile 3 | 1.33471 |
| Decile 2 | 1.2138 |
| Decile 1 | 1.0566 |
| Minimum | 0.27732 |
|
|
- Mean = 1.57757
- Std.dev = 0.422771
- 573 items above graph maximum of 3.2054
|
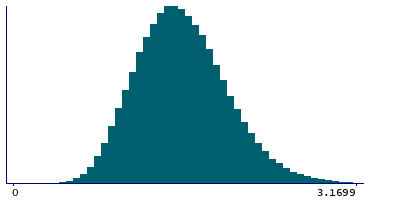
2 Instances
Instance 0 : Initial assessment visit (2006-2010) at which participants were recruited and consent given
488,083 participants, 488,083 items
| Maximum | 5.36537 |
| Decile 9 | 2.1319 |
| Decile 8 | 1.9215 |
| Decile 7 | 1.77725 |
| Decile 6 | 1.6582 |
| Median | 1.54991 |
| Decile 4 | 1.4446 |
| Decile 3 | 1.3358 |
| Decile 2 | 1.21518 |
| Decile 1 | 1.0582 |
| Minimum | 0.27732 |
|

|
- Mean = 1.57867
- Std.dev = 0.422684
- 553 items above graph maximum of 3.2056
|
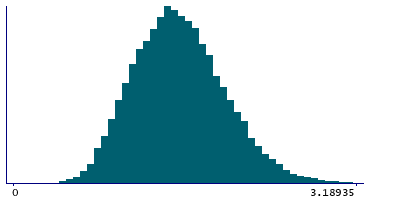
Instance 1 : First repeat assessment visit (2012-13)
19,877 participants, 19,877 items
| Maximum | 3.82181 |
| Decile 9 | 2.10895 |
| Decile 8 | 1.899 |
| Decile 7 | 1.7537 |
| Decile 6 | 1.6353 |
| Median | 1.52455 |
| Decile 4 | 1.42065 |
| Decile 3 | 1.30978 |
| Decile 2 | 1.1818 |
| Decile 1 | 1.0201 |
| Minimum | 0.365742 |
|
|
- Mean = 1.55045
- Std.dev = 0.423997
- 20 items above graph maximum of 3.19781
|


