Data
78,765 items of data are available, covering 72,674 participants.
Defined-instances run from 2 to 3, labelled using Instancing
2.
Units of measurement are g.
| Maximum | 606.143 |
| Decile 9 | 300.4 |
| Decile 8 | 267.027 |
| Decile 7 | 243.496 |
| Decile 6 | 224.505 |
| Median | 207.675 |
| Decile 4 | 191.988 |
| Decile 3 | 177.06 |
| Decile 2 | 161.444 |
| Decile 1 | 143.184 |
| Minimum | 0 |
|
|
- Mean = 216.019
- Std.dev = 62.6622
- 126 items above graph maximum of 457.616
|
2 Instances
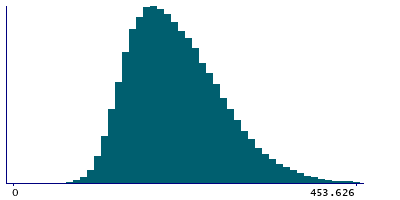
Instance 2 : Imaging visit (2014+)
72,404 participants, 72,404 items
| Maximum | 579.333 |
| Decile 9 | 300.834 |
| Decile 8 | 267.283 |
| Decile 7 | 243.809 |
| Decile 6 | 224.791 |
| Median | 207.931 |
| Decile 4 | 192.174 |
| Decile 3 | 177.197 |
| Decile 2 | 161.589 |
| Decile 1 | 143.339 |
| Minimum | 0 |
|

|
- Mean = 216.262
- Std.dev = 62.7346
- 116 items above graph maximum of 458.328
|
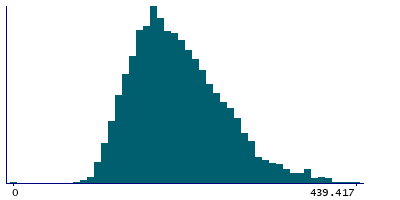
Instance 3 : First repeat imaging visit (2019+)
6,361 participants, 6,361 items
| Maximum | 606.143 |
| Decile 9 | 293.995 |
| Decile 8 | 263.983 |
| Decile 7 | 239.765 |
| Decile 6 | 220.476 |
| Median | 204.362 |
| Decile 4 | 189.36 |
| Decile 3 | 175.413 |
| Decile 2 | 160.097 |
| Decile 1 | 141.697 |
| Minimum | 0 |
|
|
- Mean = 213.263
- Std.dev = 61.7651
- 14 items above graph maximum of 446.293
|