Data
78,765 items of data are available, covering 72,674 participants.
Defined-instances run from 2 to 3, labelled using Instancing
2.
Units of measurement are g.
| Maximum | 657.739 |
| Decile 9 | 323.098 |
| Decile 8 | 283.082 |
| Decile 7 | 253.862 |
| Decile 6 | 229.351 |
| Median | 207.227 |
| Decile 4 | 186.548 |
| Decile 3 | 167.791 |
| Decile 2 | 149.157 |
| Decile 1 | 127.062 |
| Minimum | 0 |
|
|
- Mean = 217.48
- Std.dev = 76.2591
- 47 items above graph maximum of 519.133
|
2 Instances
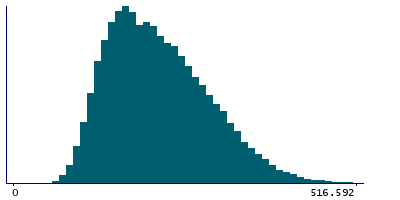
Instance 2 : Imaging visit (2014+)
72,404 participants, 72,404 items
| Maximum | 657.739 |
| Decile 9 | 322.992 |
| Decile 8 | 282.843 |
| Decile 7 | 253.653 |
| Decile 6 | 229.097 |
| Median | 206.935 |
| Decile 4 | 186.189 |
| Decile 3 | 167.482 |
| Decile 2 | 148.919 |
| Decile 1 | 126.913 |
| Minimum | 0 |
|

|
- Mean = 217.239
- Std.dev = 76.2657
- 42 items above graph maximum of 519.071
|
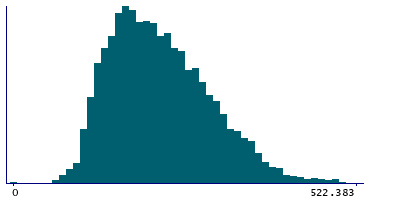
Instance 3 : First repeat imaging visit (2019+)
6,361 participants, 6,361 items
| Maximum | 617.082 |
| Decile 9 | 325.181 |
| Decile 8 | 285.466 |
| Decile 7 | 256.065 |
| Decile 6 | 231.874 |
| Median | 210.079 |
| Decile 4 | 190.294 |
| Decile 3 | 171.428 |
| Decile 2 | 152.577 |
| Decile 1 | 129.07 |
| Minimum | 0 |
|
|
- Mean = 220.225
- Std.dev = 76.1301
- 5 items above graph maximum of 521.292
|