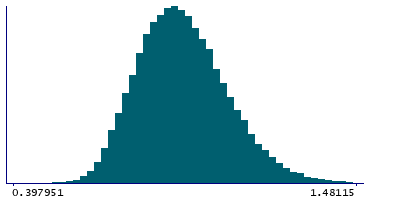
Data
78,246 items of data are available, covering 72,202 participants.
Defined-instances run from 2 to 3, labelled using Instancing
2.
Units of measurement are g/cm2.
| Maximum | 2.11308 |
| Decile 9 | 1.11461 |
| Decile 8 | 1.04256 |
| Decile 7 | 0.993005 |
| Decile 6 | 0.951781 |
| Median | 0.915322 |
| Decile 4 | 0.880437 |
| Decile 3 | 0.844095 |
| Decile 2 | 0.804236 |
| Decile 1 | 0.752682 |
| Minimum | 0 |
|
|
- Mean = 0.926573
- Std.dev = 0.142846
- 8 items below graph minimum of 0.39075
- 79 items above graph maximum of 1.47655
|
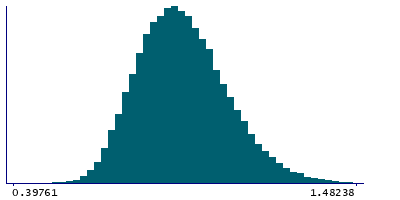
2 Instances
Instance 2 : Imaging visit (2014+)
71,935 participants, 71,935 items
| Maximum | 2.11308 |
| Decile 9 | 1.11492 |
| Decile 8 | 1.04256 |
| Decile 7 | 0.993045 |
| Decile 6 | 0.951777 |
| Median | 0.915204 |
| Decile 4 | 0.880291 |
| Decile 3 | 0.843963 |
| Decile 2 | 0.803845 |
| Decile 1 | 0.752638 |
| Minimum | 0 |
|
|
- Mean = 0.926527
- Std.dev = 0.143105
- 7 items below graph minimum of 0.390353
- 75 items above graph maximum of 1.47721
|
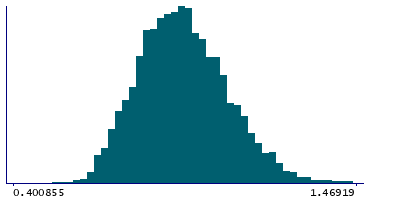
Instance 3 : First repeat imaging visit (2019+)
6,311 participants, 6,311 items
| Maximum | 1.54647 |
| Decile 9 | 1.11249 |
| Decile 8 | 1.04237 |
| Decile 7 | 0.992648 |
| Decile 6 | 0.951869 |
| Median | 0.916725 |
| Decile 4 | 0.88235 |
| Decile 3 | 0.846234 |
| Decile 2 | 0.80828 |
| Decile 1 | 0.753275 |
| Minimum | 0 |
|
|
- Mean = 0.927091
- Std.dev = 0.139867
- 1 item below graph minimum of 0.394059
- 3 items above graph maximum of 1.47171
|