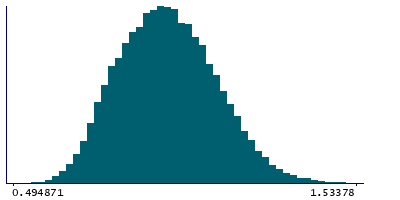
Data
39,618 items of data are available, covering 37,214 participants.
Defined-instances run from 2 to 3, labelled using Instancing
2.
Units of measurement are g/cm2.
| Maximum | 2.36914 |
| Decile 9 | 1.15563 |
| Decile 8 | 1.08656 |
| Decile 7 | 1.03687 |
| Decile 6 | 0.99337 |
| Median | 0.95356 |
| Decile 4 | 0.914148 |
| Decile 3 | 0.872528 |
| Decile 2 | 0.826752 |
| Decile 1 | 0.771296 |
| Minimum | 0.494871 |
|
|
- Mean = 0.95977
- Std.dev = 0.14926
- 19 items above graph maximum of 1.53997
|
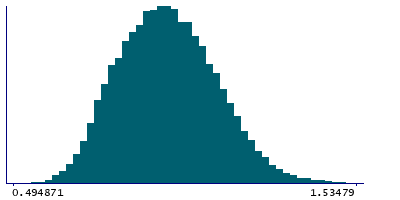
2 Instances
Instance 2 : Imaging visit (2014+)
35,837 participants, 35,837 items
| Maximum | 2.36914 |
| Decile 9 | 1.15593 |
| Decile 8 | 1.0872 |
| Decile 7 | 1.0374 |
| Decile 6 | 0.994257 |
| Median | 0.954141 |
| Decile 4 | 0.914503 |
| Decile 3 | 0.873129 |
| Decile 2 | 0.827487 |
| Decile 1 | 0.77196 |
| Minimum | 0.494871 |
|
|
- Mean = 0.960323
- Std.dev = 0.149249
- 17 items above graph maximum of 1.5399
|
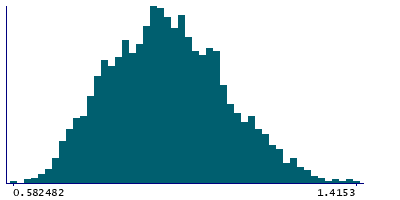
Instance 3 : First repeat imaging visit (2019+)
3,781 participants, 3,781 items
| Maximum | 1.64802 |
| Decile 9 | 1.15427 |
| Decile 8 | 1.07984 |
| Decile 7 | 1.0299 |
| Decile 6 | 0.987507 |
| Median | 0.946535 |
| Decile 4 | 0.9114 |
| Decile 3 | 0.865958 |
| Decile 2 | 0.819606 |
| Decile 1 | 0.766476 |
| Minimum | 0.548116 |
|
|
- Mean = 0.954527
- Std.dev = 0.149263
- 2 items above graph maximum of 1.54206
|