Data
51,699 items of data are available, covering 48,114 participants.
Defined-instances run from 2 to 3, labelled using Instancing
2.
Units of measurement are Std.Devs.
| Maximum | 7.55263 |
| Decile 9 | 2.18421 |
| Decile 8 | 1.60977 |
| Decile 7 | 1.21559 |
| Decile 6 | 0.873493 |
| Median | 0.558103 |
| Decile 4 | 0.244606 |
| Decile 3 | -0.100299 |
| Decile 2 | -0.493206 |
| Decile 1 | -1.02249 |
| Minimum | -8.89671 |
|

|
- Mean = 0.573675
- Std.dev = 1.24848
- 9 items below graph minimum of -4.22919
- 15 items above graph maximum of 5.39091
|
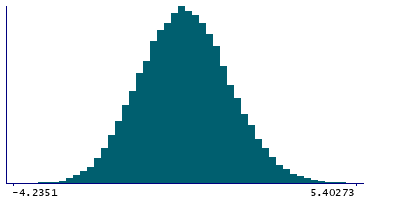
2 Instances
Instance 2 : Imaging visit (2014+)
47,685 participants, 47,685 items
| Maximum | 7.55263 |
| Decile 9 | 2.18991 |
| Decile 8 | 1.61998 |
| Decile 7 | 1.22341 |
| Decile 6 | 0.880691 |
| Median | 0.563167 |
| Decile 4 | 0.247902 |
| Decile 3 | -0.0960463 |
| Decile 2 | -0.490729 |
| Decile 1 | -1.02249 |
| Minimum | -8.89671 |
|
|
- Mean = 0.578731
- Std.dev = 1.2512
- 9 items below graph minimum of -4.2349
- 15 items above graph maximum of 5.40232
|
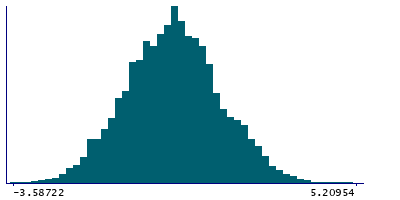
Instance 3 : First repeat imaging visit (2019+)
4,014 participants, 4,014 items
| Maximum | 5.20954 |
| Decile 9 | 2.12648 |
| Decile 8 | 1.49034 |
| Decile 7 | 1.12623 |
| Decile 6 | 0.798478 |
| Median | 0.51149 |
| Decile 4 | 0.208131 |
| Decile 3 | -0.144467 |
| Decile 2 | -0.512283 |
| Decile 1 | -1.02212 |
| Minimum | -3.58722 |
|
|
- Mean = 0.513616
- Std.dev = 1.21418
- 1 item above graph maximum of 5.20954
|