Data
39,618 items of data are available, covering 37,214 participants.
Defined-instances run from 2 to 3, labelled using Instancing
2.
Units of measurement are g/cm2.
| Maximum | 1.94221 |
| Decile 9 | 1.41021 |
| Decile 8 | 1.34362 |
| Decile 7 | 1.29415 |
| Decile 6 | 1.25137 |
| Median | 1.20822 |
| Decile 4 | 1.16524 |
| Decile 3 | 1.11914 |
| Decile 2 | 1.06537 |
| Decile 1 | 0.998567 |
| Minimum | 0.635581 |
|
|
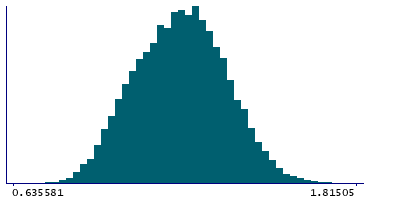
- Mean = 1.20681
- Std.dev = 0.157586
- 6 items above graph maximum of 1.82185
|
2 Instances
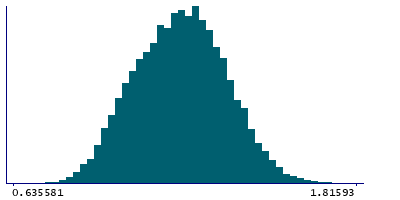
Instance 2 : Imaging visit (2014+)
35,837 participants, 35,837 items
| Maximum | 1.94221 |
| Decile 9 | 1.41052 |
| Decile 8 | 1.34374 |
| Decile 7 | 1.29401 |
| Decile 6 | 1.25165 |
| Median | 1.20867 |
| Decile 4 | 1.16509 |
| Decile 3 | 1.11933 |
| Decile 2 | 1.06562 |
| Decile 1 | 0.999029 |
| Minimum | 0.635581 |
|
|
- Mean = 1.20702
- Std.dev = 0.157652
- 6 items above graph maximum of 1.822
|
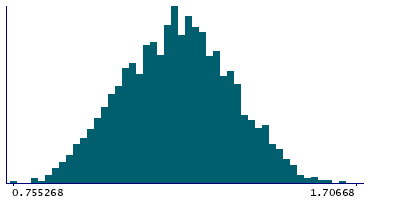
Instance 3 : First repeat imaging visit (2019+)
3,781 participants, 3,781 items
| Maximum | 1.72558 |
| Decile 9 | 1.4087 |
| Decile 8 | 1.34176 |
| Decile 7 | 1.2947 |
| Decile 6 | 1.24932 |
| Median | 1.20645 |
| Decile 4 | 1.16705 |
| Decile 3 | 1.11691 |
| Decile 2 | 1.06263 |
| Decile 1 | 0.994733 |
| Minimum | 0.693832 |
|
|
- Mean = 1.20481
- Std.dev = 0.156946
|