Data
78,765 items of data are available, covering 72,674 participants.
Defined-instances run from 2 to 3, labelled using Instancing
2.
Units of measurement are g/cm2.
| Maximum | 1.93582 |
| Decile 9 | 1.39184 |
| Decile 8 | 1.32607 |
| Decile 7 | 1.27761 |
| Decile 6 | 1.2346 |
| Median | 1.19305 |
| Decile 4 | 1.14982 |
| Decile 3 | 1.10373 |
| Decile 2 | 1.05184 |
| Decile 1 | 0.986175 |
| Minimum | 0 |
|

|
- Mean = 1.19127
- Std.dev = 0.155505
- 5 items below graph minimum of 0.58051
- 8 items above graph maximum of 1.7975
|
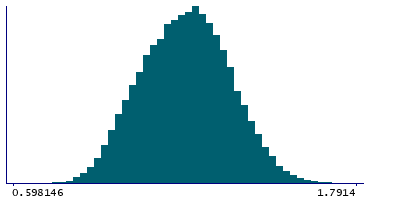
2 Instances
Instance 2 : Imaging visit (2014+)
72,404 participants, 72,404 items
| Maximum | 1.93582 |
| Decile 9 | 1.39222 |
| Decile 8 | 1.32659 |
| Decile 7 | 1.27788 |
| Decile 6 | 1.23482 |
| Median | 1.19319 |
| Decile 4 | 1.14981 |
| Decile 3 | 1.1037 |
| Decile 2 | 1.05198 |
| Decile 1 | 0.986344 |
| Minimum | 0 |
|
|
- Mean = 1.1915
- Std.dev = 0.155682
- 4 items below graph minimum of 0.580465
- 8 items above graph maximum of 1.7981
|
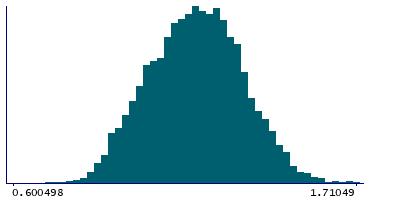
Instance 3 : First repeat imaging visit (2019+)
6,361 participants, 6,361 items
| Maximum | 1.72226 |
| Decile 9 | 1.38617 |
| Decile 8 | 1.32112 |
| Decile 7 | 1.27447 |
| Decile 6 | 1.23118 |
| Median | 1.19173 |
| Decile 4 | 1.15027 |
| Decile 3 | 1.10414 |
| Decile 2 | 1.05085 |
| Decile 1 | 0.983753 |
| Minimum | 0 |
|
|
- Mean = 1.18865
- Std.dev = 0.153451
- 1 item below graph minimum of 0.581332
|