Data
78,765 items of data are available, covering 72,674 participants.
Defined-instances run from 2 to 3, labelled using Instancing
2.
Units of measurement are g.
| Maximum | 5156.59 |
| Decile 9 | 3405.96 |
| Decile 8 | 3153.01 |
| Decile 7 | 2950.4 |
| Decile 6 | 2755.07 |
| Median | 2554.08 |
| Decile 4 | 2366.74 |
| Decile 3 | 2205.41 |
| Decile 2 | 2048.37 |
| Decile 1 | 1879.17 |
| Minimum | 0 |
|

|
- Mean = 2607.25
- Std.dev = 588.343
- 5 items above graph maximum of 4932.75
|
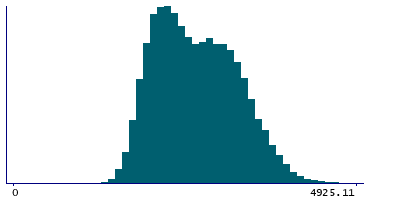
2 Instances
Instance 2 : Imaging visit (2014+)
72,404 participants, 72,404 items
| Maximum | 5156.59 |
| Decile 9 | 3405.69 |
| Decile 8 | 3152.18 |
| Decile 7 | 2949.66 |
| Decile 6 | 2753.75 |
| Median | 2553.12 |
| Decile 4 | 2365.81 |
| Decile 3 | 2204.51 |
| Decile 2 | 2048.13 |
| Decile 1 | 1878.95 |
| Minimum | 0 |
|
|
- Mean = 2606.53
- Std.dev = 588.438
- 5 items above graph maximum of 4932.43
|
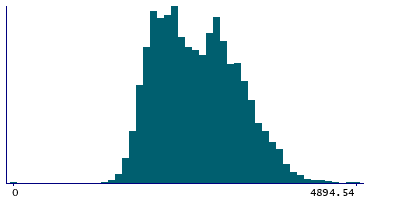
Instance 3 : First repeat imaging visit (2019+)
6,361 participants, 6,361 items
| Maximum | 4894.54 |
| Decile 9 | 3408.55 |
| Decile 8 | 3166.34 |
| Decile 7 | 2958.76 |
| Decile 6 | 2771.16 |
| Median | 2566.92 |
| Decile 4 | 2378.86 |
| Decile 3 | 2221.77 |
| Decile 2 | 2053.09 |
| Decile 1 | 1884.13 |
| Minimum | 0 |
|
|
- Mean = 2615.53
- Std.dev = 587.204
|