Data
78,765 items of data are available, covering 72,674 participants.
Defined-instances run from 2 to 3, labelled using Instancing
2.
Units of measurement are g/cm2.
| Maximum | 2.65607 |
| Decile 9 | 1.35043 |
| Decile 8 | 1.25893 |
| Decile 7 | 1.19551 |
| Decile 6 | 1.14083 |
| Median | 1.09133 |
| Decile 4 | 1.0423 |
| Decile 3 | 0.991683 |
| Decile 2 | 0.934418 |
| Decile 1 | 0.865247 |
| Minimum | 0 |
|

|
- Mean = 1.10242
- Std.dev = 0.190801
- 81 items above graph maximum of 1.83562
|
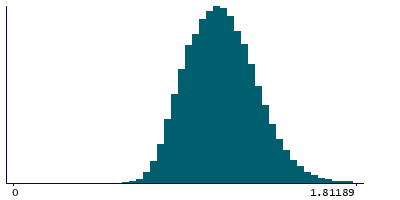
2 Instances
Instance 2 : Imaging visit (2014+)
72,404 participants, 72,404 items
| Maximum | 2.65607 |
| Decile 9 | 1.35065 |
| Decile 8 | 1.2594 |
| Decile 7 | 1.19589 |
| Decile 6 | 1.14078 |
| Median | 1.09136 |
| Decile 4 | 1.04194 |
| Decile 3 | 0.991506 |
| Decile 2 | 0.93423 |
| Decile 1 | 0.865022 |
| Minimum | 0 |
|
|
- Mean = 1.10248
- Std.dev = 0.191098
- 72 items above graph maximum of 1.83628
|
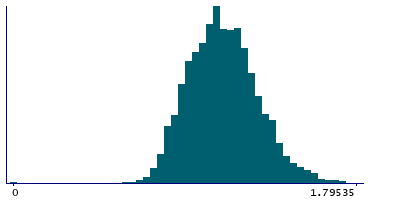
Instance 3 : First repeat imaging visit (2019+)
6,361 participants, 6,361 items
| Maximum | 2.08358 |
| Decile 9 | 1.34607 |
| Decile 8 | 1.25333 |
| Decile 7 | 1.19232 |
| Decile 6 | 1.14162 |
| Median | 1.09079 |
| Decile 4 | 1.04486 |
| Decile 3 | 0.994085 |
| Decile 2 | 0.936031 |
| Decile 1 | 0.868588 |
| Minimum | 0 |
|
|
- Mean = 1.10172
- Std.dev = 0.187379
- 7 items above graph maximum of 1.82355
|