Data
78,765 items of data are available, covering 72,674 participants.
Defined-instances run from 2 to 3, labelled using Instancing
2.
Units of measurement are g/cm2.
| Maximum | 3.15733 |
| Decile 9 | 1.03563 |
| Decile 8 | 0.971815 |
| Decile 7 | 0.922436 |
| Decile 6 | 0.877548 |
| Median | 0.835198 |
| Decile 4 | 0.793036 |
| Decile 3 | 0.74995 |
| Decile 2 | 0.704425 |
| Decile 1 | 0.648096 |
| Minimum | 0 |
|

|
- Mean = 0.839393
- Std.dev = 0.148255
- 8 items above graph maximum of 1.42317
|
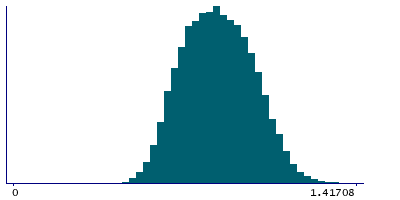
2 Instances
Instance 2 : Imaging visit (2014+)
72,404 participants, 72,404 items
| Maximum | 3.15733 |
| Decile 9 | 1.03644 |
| Decile 8 | 0.972619 |
| Decile 7 | 0.922941 |
| Decile 6 | 0.878207 |
| Median | 0.835698 |
| Decile 4 | 0.793471 |
| Decile 3 | 0.750215 |
| Decile 2 | 0.704887 |
| Decile 1 | 0.648547 |
| Minimum | 0 |
|
|
- Mean = 0.83999
- Std.dev = 0.148509
- 8 items above graph maximum of 1.42433
|
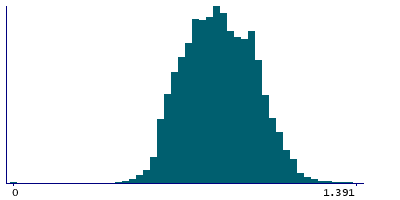
Instance 3 : First repeat imaging visit (2019+)
6,361 participants, 6,361 items
| Maximum | 1.41117 |
| Decile 9 | 1.02432 |
| Decile 8 | 0.963317 |
| Decile 7 | 0.91557 |
| Decile 6 | 0.869428 |
| Median | 0.829331 |
| Decile 4 | 0.788187 |
| Decile 3 | 0.746042 |
| Decile 2 | 0.699426 |
| Decile 1 | 0.643449 |
| Minimum | 0 |
|
|
- Mean = 0.832598
- Std.dev = 0.145168
- 1 item above graph maximum of 1.4052
|