Data
78,765 items of data are available, covering 72,674 participants.
Defined-instances run from 2 to 3, labelled using Instancing
2.
Units of measurement are g/cm2.
| Maximum | 2.08653 |
| Decile 9 | 1.46862 |
| Decile 8 | 1.3901 |
| Decile 7 | 1.32918 |
| Decile 6 | 1.27188 |
| Median | 1.21704 |
| Decile 4 | 1.16405 |
| Decile 3 | 1.10893 |
| Decile 2 | 1.05039 |
| Decile 1 | 0.977705 |
| Minimum | 0 |
|

|
- Mean = 1.22149
- Std.dev = 0.188496
- 8 items above graph maximum of 1.95953
|
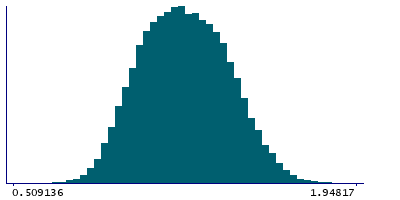
2 Instances
Instance 2 : Imaging visit (2014+)
72,404 participants, 72,404 items
| Maximum | 2.08653 |
| Decile 9 | 1.46877 |
| Decile 8 | 1.39007 |
| Decile 7 | 1.32867 |
| Decile 6 | 1.27145 |
| Median | 1.21646 |
| Decile 4 | 1.16362 |
| Decile 3 | 1.10848 |
| Decile 2 | 1.05017 |
| Decile 1 | 0.977566 |
| Minimum | 0 |
|
|
- Mean = 1.22126
- Std.dev = 0.188623
- 8 items above graph maximum of 1.95997
|
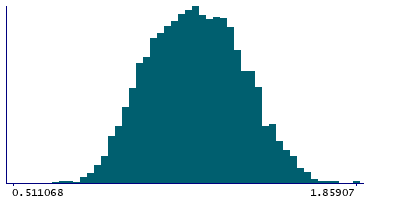
Instance 3 : First repeat imaging visit (2019+)
6,361 participants, 6,361 items
| Maximum | 1.85907 |
| Decile 9 | 1.46722 |
| Decile 8 | 1.39077 |
| Decile 7 | 1.33493 |
| Decile 6 | 1.27727 |
| Median | 1.22297 |
| Decile 4 | 1.16812 |
| Decile 3 | 1.11339 |
| Decile 2 | 1.0539 |
| Decile 1 | 0.979677 |
| Minimum | 0 |
|
|
- Mean = 1.22407
- Std.dev = 0.187015
- 1 item below graph minimum of 0.492138
|