Data
39,618 items of data are available, covering 37,214 participants.
Defined-instances run from 2 to 3, labelled using Instancing
2.
Units of measurement are g.
| Maximum | 1049.25 |
| Decile 9 | 656.526 |
| Decile 8 | 604.991 |
| Decile 7 | 562.946 |
| Decile 6 | 520.461 |
| Median | 475.819 |
| Decile 4 | 436.527 |
| Decile 3 | 404.073 |
| Decile 2 | 374.704 |
| Decile 1 | 341.471 |
| Minimum | 58.2074 |
|
|
- Mean = 489.638
- Std.dev = 121.796
- 4 items above graph maximum of 971.582
|
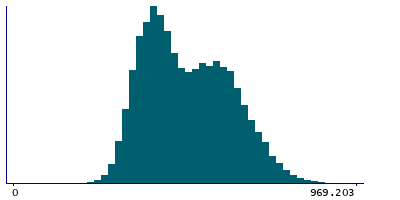
2 Instances
Instance 2 : Imaging visit (2014+)
35,837 participants, 35,837 items
| Maximum | 1049.25 |
| Decile 9 | 656.079 |
| Decile 8 | 604.888 |
| Decile 7 | 562.355 |
| Decile 6 | 520.049 |
| Median | 475.324 |
| Decile 4 | 436.131 |
| Decile 3 | 404.158 |
| Decile 2 | 374.931 |
| Decile 1 | 341.704 |
| Minimum | 58.2074 |
|

|
- Mean = 489.454
- Std.dev = 121.638
- 4 items above graph maximum of 970.454
|
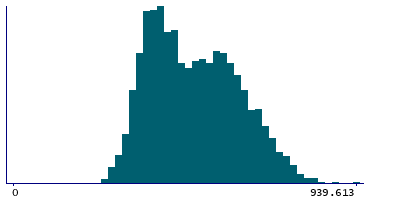
Instance 3 : First repeat imaging visit (2019+)
3,781 participants, 3,781 items
| Maximum | 939.613 |
| Decile 9 | 660.244 |
| Decile 8 | 606.465 |
| Decile 7 | 567.643 |
| Decile 6 | 524.52 |
| Median | 481.002 |
| Decile 4 | 439.853 |
| Decile 3 | 403.531 |
| Decile 2 | 372.754 |
| Decile 1 | 339.72 |
| Minimum | 199.055 |
|
|
- Mean = 491.376
- Std.dev = 123.273
|