Data
39,618 items of data are available, covering 37,214 participants.
Defined-instances run from 2 to 3, labelled using Instancing
2.
Units of measurement are g/cm2.
| Maximum | 2.13702 |
| Decile 9 | 1.46684 |
| Decile 8 | 1.38742 |
| Decile 7 | 1.32595 |
| Decile 6 | 1.26782 |
| Median | 1.21427 |
| Decile 4 | 1.16153 |
| Decile 3 | 1.10598 |
| Decile 2 | 1.04762 |
| Decile 1 | 0.974765 |
| Minimum | 0.596318 |
|
|
- Mean = 1.21906
- Std.dev = 0.189694
- 8 items above graph maximum of 1.95891
|
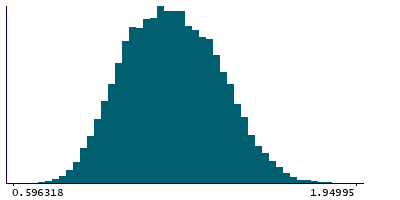
2 Instances
Instance 2 : Imaging visit (2014+)
35,837 participants, 35,837 items
| Maximum | 2.13702 |
| Decile 9 | 1.46651 |
| Decile 8 | 1.3871 |
| Decile 7 | 1.32542 |
| Decile 6 | 1.26761 |
| Median | 1.2139 |
| Decile 4 | 1.16143 |
| Decile 3 | 1.10582 |
| Decile 2 | 1.04798 |
| Decile 1 | 0.97484 |
| Minimum | 0.596318 |
|

|
- Mean = 1.2189
- Std.dev = 0.189652
- 8 items above graph maximum of 1.95817
|
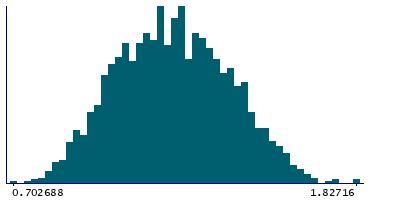
Instance 3 : First repeat imaging visit (2019+)
3,781 participants, 3,781 items
| Maximum | 1.82716 |
| Decile 9 | 1.47221 |
| Decile 8 | 1.39396 |
| Decile 7 | 1.33329 |
| Decile 6 | 1.27146 |
| Median | 1.2203 |
| Decile 4 | 1.16301 |
| Decile 3 | 1.10663 |
| Decile 2 | 1.04456 |
| Decile 1 | 0.97345 |
| Minimum | 0.693773 |
|
|
- Mean = 1.22052
- Std.dev = 0.190085
|