Data
37,044 items of data are available, covering 35,497 participants.
Defined-instances run from 2 to 3, labelled using Instancing
2.
Units of measurement are g/cm2.
| Maximum | 2.81435 |
| Decile 9 | 1.31529 |
| Decile 8 | 1.24036 |
| Decile 7 | 1.18851 |
| Decile 6 | 1.14473 |
| Median | 1.10511 |
| Decile 4 | 1.06605 |
| Decile 3 | 1.02663 |
| Decile 2 | 0.981369 |
| Decile 1 | 0.922657 |
| Minimum | 0 |
|
|
- Mean = 1.11343
- Std.dev = 0.155425
- 16 items below graph minimum of 0.530022
- 31 items above graph maximum of 1.70793
|
2 Instances
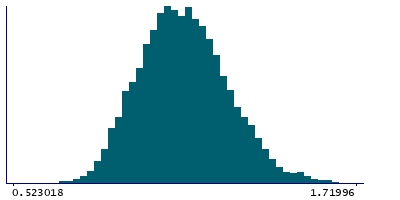
Instance 2 : Imaging visit (2014+)
34,934 participants, 34,934 items
| Maximum | 2.81435 |
| Decile 9 | 1.31618 |
| Decile 8 | 1.24111 |
| Decile 7 | 1.18926 |
| Decile 6 | 1.14546 |
| Median | 1.10559 |
| Decile 4 | 1.0664 |
| Decile 3 | 1.02683 |
| Decile 2 | 0.981661 |
| Decile 1 | 0.922564 |
| Minimum | 0 |
|

|
- Mean = 1.11389
- Std.dev = 0.155878
- 16 items below graph minimum of 0.528945
- 30 items above graph maximum of 1.7098
|
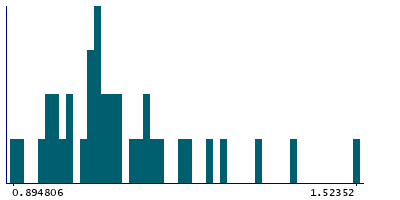
Instance 3 : First repeat imaging visit (2019+)
2,110 participants, 2,110 items
| Maximum | 1.68771 |
| Decile 9 | 1.29674 |
| Decile 8 | 1.22816 |
| Decile 7 | 1.17603 |
| Decile 6 | 1.13422 |
| Median | 1.0953 |
| Decile 4 | 1.06193 |
| Decile 3 | 1.02394 |
| Decile 2 | 0.977372 |
| Decile 1 | 0.923618 |
| Minimum | 0.703828 |
|
|
- Mean = 1.10588
- Std.dev = 0.147531
- 1 item above graph maximum of 1.66985
|