Data
73,670 items of data are available, covering 68,408 participants.
Defined-instances run from 2 to 3, labelled using Instancing
2.
Units of measurement are cm.
| Maximum | 11.6776 |
| Decile 9 | 4.93462 |
| Decile 8 | 4.74276 |
| Decile 7 | 4.59984 |
| Decile 6 | 4.47208 |
| Median | 4.3468 |
| Decile 4 | 4.22621 |
| Decile 3 | 4.10896 |
| Decile 2 | 3.98988 |
| Decile 1 | 3.84766 |
| Minimum | 2.3942 |
|
|
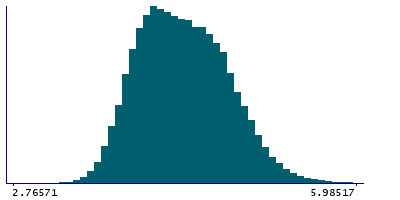
- Mean = 4.37451
- Std.dev = 0.427219
- 2 items below graph minimum of 2.7607
- 62 items above graph maximum of 6.02158
|
2 Instances
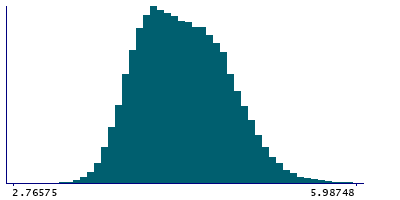
Instance 2 : Imaging visit (2014+)
68,015 participants, 68,015 items
| Maximum | 11.6776 |
| Decile 9 | 4.93491 |
| Decile 8 | 4.74332 |
| Decile 7 | 4.60028 |
| Decile 6 | 4.47319 |
| Median | 4.34694 |
| Decile 4 | 4.2262 |
| Decile 3 | 4.10925 |
| Decile 2 | 3.99071 |
| Decile 1 | 3.84863 |
| Minimum | 2.3942 |
|
|
- Mean = 4.37502
- Std.dev = 0.427123
- 2 items below graph minimum of 2.76234
- 55 items above graph maximum of 6.0212
|
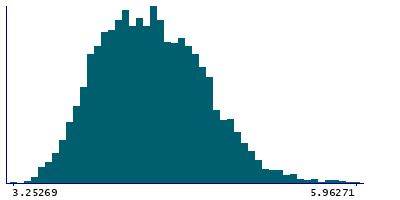
Instance 3 : First repeat imaging visit (2019+)
5,655 participants, 5,655 items
| Maximum | 6.66368 |
| Decile 9 | 4.93017 |
| Decile 8 | 4.73475 |
| Decile 7 | 4.59463 |
| Decile 6 | 4.46156 |
| Median | 4.34379 |
| Decile 4 | 4.22651 |
| Decile 3 | 4.10524 |
| Decile 2 | 3.9811 |
| Decile 1 | 3.83772 |
| Minimum | 3.25269 |
|
|
- Mean = 4.3683
- Std.dev = 0.428315
- 7 items above graph maximum of 6.02263
|