Data
73,670 items of data are available, covering 68,408 participants.
Defined-instances run from 2 to 3, labelled using Instancing
2.
Units of measurement are cm2.
| Maximum | 138.439 |
| Decile 9 | 71.7442 |
| Decile 8 | 67.8803 |
| Decile 7 | 64.95 |
| Decile 6 | 62.1773 |
| Median | 59.5664 |
| Decile 4 | 57.1199 |
| Decile 3 | 54.8373 |
| Decile 2 | 52.5429 |
| Decile 1 | 49.76 |
| Minimum | 31.63 |
|
|
- Mean = 60.2627
- Std.dev = 8.47611
- 17 items above graph maximum of 93.7283
|
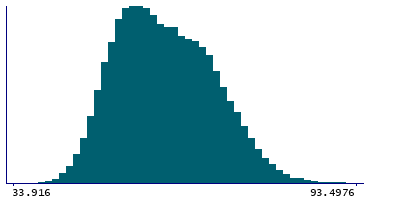
2 Instances
Instance 2 : Imaging visit (2014+)
68,015 participants, 68,015 items
| Maximum | 138.439 |
| Decile 9 | 71.7168 |
| Decile 8 | 67.8709 |
| Decile 7 | 64.9311 |
| Decile 6 | 62.1531 |
| Median | 59.551 |
| Decile 4 | 57.1096 |
| Decile 3 | 54.8392 |
| Decile 2 | 52.5502 |
| Decile 1 | 49.7702 |
| Minimum | 31.63 |
|

|
- Mean = 60.2516
- Std.dev = 8.46204
- 15 items above graph maximum of 93.6633
|
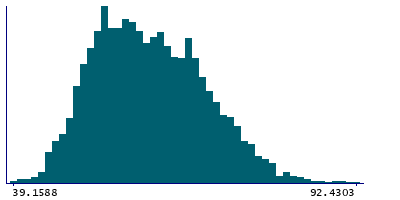
Instance 3 : First repeat imaging visit (2019+)
5,655 participants, 5,655 items
| Maximum | 103.868 |
| Decile 9 | 72.1517 |
| Decile 8 | 67.9702 |
| Decile 7 | 65.1523 |
| Decile 6 | 62.3897 |
| Median | 59.8177 |
| Decile 4 | 57.269 |
| Decile 3 | 54.8028 |
| Decile 2 | 52.4552 |
| Decile 1 | 49.6309 |
| Minimum | 38.8911 |
|
|
- Mean = 60.3963
- Std.dev = 8.64233
- 2 items above graph maximum of 94.6725
|