Data
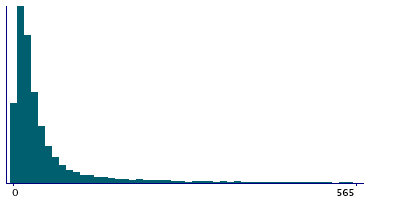
9,960 items of data are available, covering 9,683 participants.
Defined-instances run from 0 to 1, labelled using Instancing
2.
| Maximum | 10661 |
| Decile 9 | 285 |
| Decile 8 | 92 |
| Decile 7 | 54 |
| Decile 6 | 38 |
| Median | 28 |
| Decile 4 | 22 |
| Decile 3 | 16 |
| Decile 2 | 11 |
| Decile 1 | 6 |
| Minimum | 1 |
|

|
- There are 1041 distinct values.
- Mean = 178.303
- Std.dev = 653.152
- 659 items above graph maximum of 564
|
2 Instances
Instance 0 : Initial assessment visit (2006-2010) at which participants were recruited and consent given
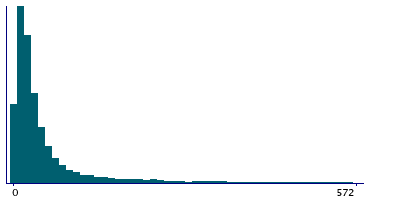
9,423 participants, 9,423 items
| Maximum | 10515 |
| Decile 9 | 288 |
| Decile 8 | 94.5 |
| Decile 7 | 55 |
| Decile 6 | 38 |
| Median | 28 |
| Decile 4 | 22 |
| Decile 3 | 16 |
| Decile 2 | 11 |
| Decile 1 | 6 |
| Minimum | 1 |
|

|
- There are 1007 distinct values.
- Mean = 177.667
- Std.dev = 638.06
- 623 items above graph maximum of 570
|
Instance 1 : First repeat assessment visit (2012-13)
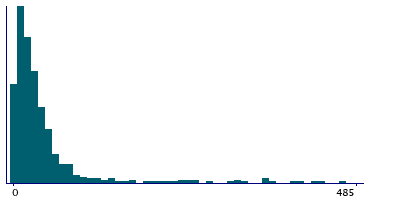
537 participants, 537 items
| Maximum | 10661 |
| Decile 9 | 244.5 |
| Decile 8 | 67 |
| Decile 7 | 44 |
| Decile 6 | 33 |
| Median | 26 |
| Decile 4 | 19 |
| Decile 3 | 14 |
| Decile 2 | 10 |
| Decile 1 | 4 |
| Minimum | 1 |
|

|
- There are 157 distinct values.
- Mean = 189.475
- Std.dev = 876.598
- 35 items above graph maximum of 485
|
Notes
Measured level of VacA antigen for H. pylori (Helicobacter pylori).
0 Related Data-Fields
There are no related data-fields
0 Resources
There are no matching Resources
1 Application
| Application ID | Title |
|---|
| 45925 | Risk Factors, Biomarkers and Impact of Major Vision-Threatening Eye Diseases |


