Data
42,549 items of data are available, covering 37,680 participants.
Defined-instances run from 0 to 1, labelled using Instancing
178.
Units of measurement are deciseconds.
| Maximum | 880 |
| Decile 9 | 163 |
| Decile 8 | 138 |
| Decile 7 | 120 |
| Decile 6 | 110 |
| Median | 100 |
| Decile 4 | 90 |
| Decile 3 | 82 |
| Decile 2 | 74 |
| Decile 1 | 65 |
| Minimum | 10 |
|
|
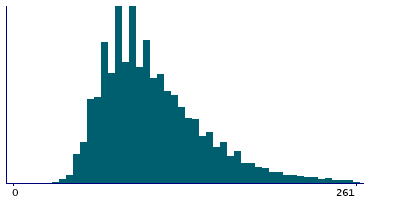
- There are 375 distinct values.
- Mean = 108.779
- Std.dev = 44.6404
- 391 items above graph maximum of 261
|
2 Instances
Instance 0 : Assessment run 2014
32,376 participants, 32,376 items
| Maximum | 880 |
| Decile 9 | 167 |
| Decile 8 | 140 |
| Decile 7 | 123 |
| Decile 6 | 110 |
| Median | 100 |
| Decile 4 | 91 |
| Decile 3 | 83 |
| Decile 2 | 75 |
| Decile 1 | 65 |
| Minimum | 13 |
|
|
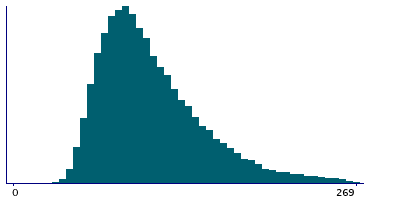
- There are 373 distinct values.
- Mean = 110.588
- Std.dev = 46.8136
- 329 items above graph maximum of 269
|
Instance 1 : Assessment run 2021
10,173 participants, 10,173 items
| Maximum | 340 |
| Decile 9 | 150 |
| Decile 8 | 130 |
| Decile 7 | 120 |
| Decile 6 | 100 |
| Median | 100 |
| Decile 4 | 90 |
| Decile 3 | 80 |
| Decile 2 | 70 |
| Decile 1 | 60 |
| Minimum | 10 |
|
|
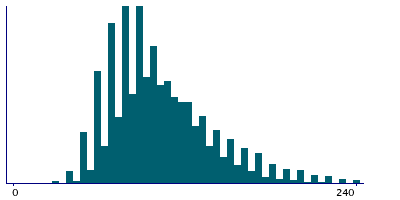
- There are 33 distinct values.
- Mean = 103.019
- Std.dev = 36.2856
- 32 items above graph maximum of 240
|
Notes
Indicates how long a participant viewed question FI9 before selecting their answer and clicking Next.
2 Related Data-Fields
| Field ID | Description | Relationship |
|---|
| 20181 | FI9 : concept interpolation | Current Field is the duration spent viewing before entering the answer in Field 20181 |
| 5557 | FI9 : duration viewed | Field 5557 is the touchscreen equivalent of web-based Current Field |