Data
300,772 items of data are available, covering 237,048 participants.
Defined-instances run from 0 to 3, labelled using Instancing
2.
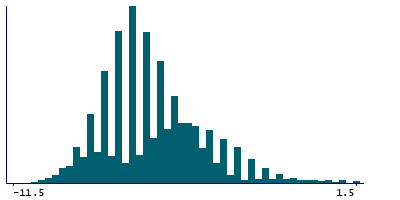
| Maximum | 8 |
| Decile 9 | -3.5 |
| Decile 8 | -4.5 |
| Decile 7 | -5.5 |
| Decile 6 | -6 |
| Median | -6.5 |
| Decile 4 | -7 |
| Decile 3 | -7.5 |
| Decile 2 | -8 |
| Decile 1 | -8.5 |
| Minimum | -11.5 |
|
|
- Mean = -5.99872
- Std.dev = 2.34434
- 3705 items above graph maximum of 1.5
|
4 Instances
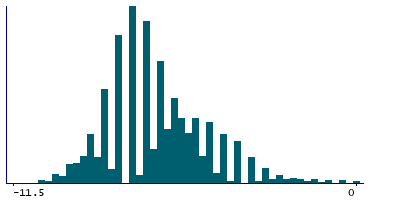
Instance 0 : Initial assessment visit (2006-2010) at which participants were recruited and consent given
163,029 participants, 163,029 items
| Maximum | 8 |
| Decile 9 | -4.5 |
| Decile 8 | -5.5 |
| Decile 7 | -6 |
| Decile 6 | -6.5 |
| Median | -7 |
| Decile 4 | -7 |
| Decile 3 | -7.5 |
| Decile 2 | -8 |
| Decile 1 | -8.5 |
| Minimum | -11.5 |
|
|
- Mean = -6.54654
- Std.dev = 2.10873
- 1865 items above graph maximum of 0
|
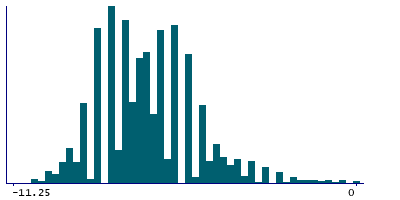
Instance 1 : First repeat assessment visit (2012-13)
19,823 participants, 19,823 items
| Maximum | 8 |
| Decile 9 | -4.5 |
| Decile 8 | -5.5 |
| Decile 7 | -6 |
| Decile 6 | -6.5 |
| Median | -7 |
| Decile 4 | -7.5 |
| Decile 3 | -7.5 |
| Decile 2 | -8 |
| Decile 1 | -8.5 |
| Minimum | -11.25 |
|
|
- Mean = -6.69636
- Std.dev = 2.01042
- 208 items above graph maximum of 0
|
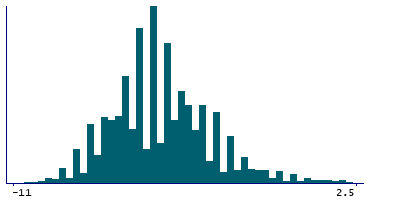
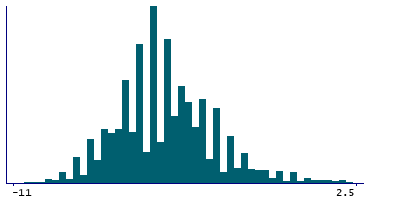
Instance 2 : Imaging visit (2014+)
97,509 participants, 97,509 items
| Maximum | 8 |
| Decile 9 | -2.5 |
| Decile 8 | -3.5 |
| Decile 7 | -4.5 |
| Decile 6 | -5 |
| Median | -5.5 |
| Decile 4 | -6 |
| Decile 3 | -6.5 |
| Decile 2 | -7 |
| Decile 1 | -7.5 |
| Minimum | -11 |
|
|
- Mean = -5.08317
- Std.dev = 2.41348
- 1609 items above graph maximum of 2.5
|
Instance 3 : First repeat imaging visit (2019+)
20,411 participants, 20,411 items
| Maximum | 8 |
| Decile 9 | -2.5 |
| Decile 8 | -4 |
| Decile 7 | -4.5 |
| Decile 6 | -5 |
| Median | -5.5 |
| Decile 4 | -6 |
| Decile 3 | -6.5 |
| Decile 2 | -7.5 |
| Decile 1 | -8 |
| Minimum | -11.25 |
|
|
- Mean = -5.31941
- Std.dev = 2.5261
- 274 items above graph maximum of 3
|


