Data
624,749 items of data are available, covering 501,109 participants.
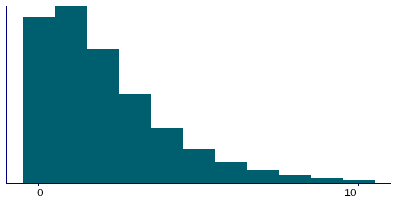
Defined-instances run from 0 to 3, labelled using Instancing
2.
| Maximum | 37 |
| Decile 9 | 6 |
| Decile 8 | 4 |
| Decile 7 | 3 |
| Decile 6 | 2 |
| Median | 2 |
| Decile 4 | 1 |
| Decile 3 | 1 |
| Decile 2 | 0 |
| Decile 1 | 0 |
| Minimum | 0 |
|
|
- There are 36 distinct values.
- Mean = 2.37208
- Std.dev = 2.5896
- 5375 items above graph maximum of 12
|
4 Instances
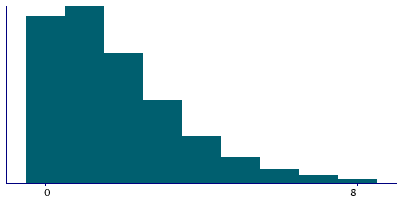
Instance 0 : Initial assessment visit (2006-2010) at which participants were recruited and consent given
501,076 participants, 501,076 items
| Maximum | 29 |
| Decile 9 | 4 |
| Decile 8 | 3 |
| Decile 7 | 2 |
| Decile 6 | 2 |
| Median | 1 |
| Decile 4 | 1 |
| Decile 3 | 1 |
| Decile 2 | 0 |
| Decile 1 | 0 |
| Minimum | 0 |
|
|
- There are 29 distinct values.
- Mean = 1.86368
- Std.dev = 1.86868
- 4080 items above graph maximum of 8
|
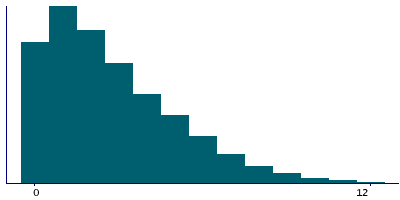
Instance 1 : First repeat assessment visit (2012-13)
20,313 participants, 20,313 items
| Maximum | 16 |
| Decile 9 | 6 |
| Decile 8 | 5 |
| Decile 7 | 4 |
| Decile 6 | 3 |
| Median | 2 |
| Decile 4 | 2 |
| Decile 3 | 1 |
| Decile 2 | 1 |
| Decile 1 | 0 |
| Minimum | 0 |
|
|
- There are 16 distinct values.
- Mean = 2.73923
- Std.dev = 2.3455
- 23 items above graph maximum of 12
|
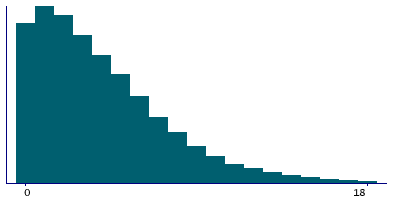
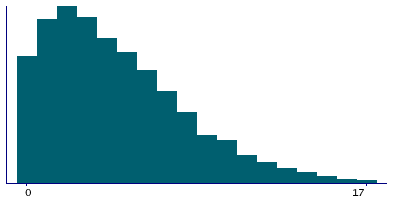
Instance 2 : Imaging visit (2014+)
89,066 participants, 89,066 items
| Maximum | 37 |
| Decile 9 | 10 |
| Decile 8 | 8 |
| Decile 7 | 6 |
| Decile 6 | 5 |
| Median | 4 |
| Decile 4 | 3 |
| Decile 3 | 2 |
| Decile 2 | 1 |
| Decile 1 | 0 |
| Minimum | 0 |
|
|
- There are 36 distinct values.
- Mean = 4.6456
- Std.dev = 3.93468
- 277 items above graph maximum of 20
|
Instance 3 : First repeat imaging visit (2019+)
14,294 participants, 14,294 items
| Maximum | 28 |
| Decile 9 | 11 |
| Decile 8 | 8 |
| Decile 7 | 7 |
| Decile 6 | 6 |
| Median | 5 |
| Decile 4 | 4 |
| Decile 3 | 3 |
| Decile 2 | 2 |
| Decile 1 | 1 |
| Minimum | 0 |
|
|
- There are 28 distinct values.
- Mean = 5.50602
- Std.dev = 3.88907
- 20 items above graph maximum of 21
|


