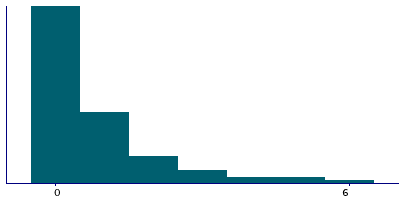
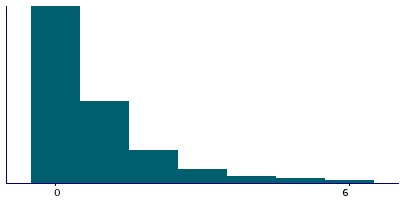
Data
643,194 items of data are available, covering 501,084 participants.
Some values have special meanings defined by Data-Coding
100373.
Defined-instances run from 0 to 3, labelled using Instancing
2.
Units of measurement are pieces/day.
| Maximum | 100 |
| Decile 9 | 3 |
| Decile 8 | 1 |
| Decile 7 | 1 |
| Decile 6 | 1 |
| Median | 0 |
| Decile 4 | 0 |
| Decile 3 | 0 |
| Decile 2 | 0 |
| Decile 1 | 0 |
| Minimum | 0 |
|
|
- There are 50 distinct values.
- Mean = 0.906773
- Std.dev = 1.82961
- 7360 items above graph maximum of 6
- 51033 items have value -10 (Less than one)
- 611 items have value -3 (Prefer not to answer)
- 6249 items have value -1 (Do not know)
|
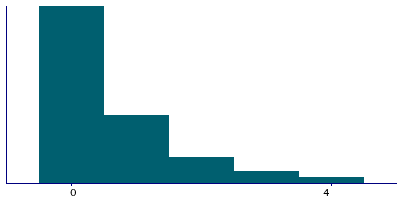
4 Instances
Instance 0 : Initial assessment visit (2006-2010) at which participants were recruited and consent given
501,043 participants, 501,043 items
| Maximum | 100 |
| Decile 9 | 2 |
| Decile 8 | 1 |
| Decile 7 | 1 |
| Decile 6 | 1 |
| Median | 0 |
| Decile 4 | 0 |
| Decile 3 | 0 |
| Decile 2 | 0 |
| Decile 1 | 0 |
| Minimum | 0 |
|
|
- There are 50 distinct values.
- Mean = 0.881798
- Std.dev = 1.82405
- 18211 items above graph maximum of 4
- 39090 items have value -10 (Less than one)
- 560 items have value -3 (Prefer not to answer)
- 5496 items have value -1 (Do not know)
|
Instance 1 : First repeat assessment visit (2012-13)
20,314 participants, 20,314 items
| Maximum | 40 |
| Decile 9 | 3 |
| Decile 8 | 2 |
| Decile 7 | 1 |
| Decile 6 | 1 |
| Median | 0 |
| Decile 4 | 0 |
| Decile 3 | 0 |
| Decile 2 | 0 |
| Decile 1 | 0 |
| Minimum | 0 |
|
|
- There are 19 distinct values.
- Mean = 0.955133
- Std.dev = 1.65912
- 210 items above graph maximum of 6
- 1799 items have value -10 (Less than one)
- 7 items have value -3 (Prefer not to answer)
- 98 items have value -1 (Do not know)
|
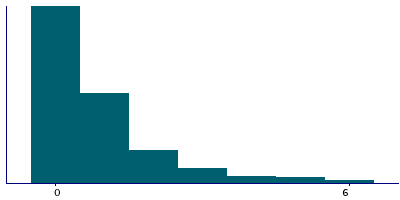
Instance 2 : Imaging visit (2014+)
100,917 participants, 100,917 items
| Maximum | 100 |
| Decile 9 | 3 |
| Decile 8 | 2 |
| Decile 7 | 1 |
| Decile 6 | 1 |
| Median | 0 |
| Decile 4 | 0 |
| Decile 3 | 0 |
| Decile 2 | 0 |
| Decile 1 | 0 |
| Minimum | 0 |
|
|
- There are 32 distinct values.
- Mean = 1.00346
- Std.dev = 1.86302
- 1220 items above graph maximum of 6
- 8484 items have value -10 (Less than one)
- 36 items have value -3 (Prefer not to answer)
- 552 items have value -1 (Do not know)
|
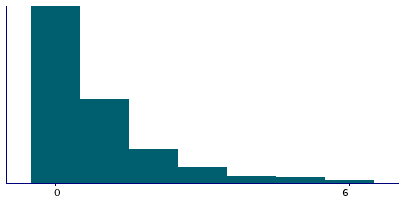
Instance 3 : First repeat imaging visit (2019+)
20,920 participants, 20,920 items
| Maximum | 100 |
| Decile 9 | 3 |
| Decile 8 | 2 |
| Decile 7 | 1 |
| Decile 6 | 1 |
| Median | 0 |
| Decile 4 | 0 |
| Decile 3 | 0 |
| Decile 2 | 0 |
| Decile 1 | 0 |
| Minimum | 0 |
|
|
- There are 24 distinct values.
- Mean = 0.991122
- Std.dev = 1.93444
- 223 items above graph maximum of 6
- 1660 items have value -10 (Less than one)
- 8 items have value -3 (Prefer not to answer)
- 103 items have value -1 (Do not know)
|
Notes
ACE touchscreen question "About how many pieces of DRIED fruit would you eat per DAY? (Count one prune, one dried apricot, 10 raisins as one piece; put '0' if you do not eat any)"
The following checks were performed:
- If answer > 100 then rejected
If the participant activated the Help button they were shown the message:
Please provide an average considering your intake over the last year.
If you are unsure, please provide an estimate or select Do not know.
|
Coding 100373 defines 3 special values:
- -10 represents "Less than one"
- -1 represents "Do not know"
- -3 represents "Prefer not to answer"
0 Related Data-Fields
There are no related data-fields
9 Applications
| Application ID | Title |
|---|
| 5974 | Development and validation of risk prediction models for cancer. |
| 23183 | Dietary iron intake and public health risk |
| 14935 | Electronic Longitudinal Alcohol Study in Communities (ELAStiC) |
| 48818 | Evaluate the causal effects of diet-modifiable biomarkers on clinical outcomes using Mendelian randomization |
| 29009 | Food consumption (coffee, dairy products and soft drinks), Mediterranean dietary pattern and risk of falls or hearing loss in the elderly. |
| 24494 | Mediating mechanisms linking anthropometric, lifestyle and dietary risk factors with cancer risk |
| 20175 | Nutrition, diet and health: examining causal associations and gene-environment interactions |
| 15008 | The impact of smoking, alcohol and adiposity on health outcomes in the UK Biobank |
| 20684 | Understanding the associations between environmental exposures, health behaviours and health outcomes |


