Data
187,662 items of data are available, covering 82,607 participants.
Defined-instances run from 2 to 3, labelled using Instancing
2.
Array indices run from 0 to 5.
Units of measurement are litres/min/m2.
| Maximum | 34.26 |
| Decile 9 | 6.25 |
| Decile 8 | 5.32 |
| Decile 7 | 4.73 |
| Decile 6 | 4.26 |
| Median | 3.88 |
| Decile 4 | 3.54 |
| Decile 3 | 3.21 |
| Decile 2 | 2.87 |
| Decile 1 | 2.43 |
| Minimum | -99 |
|

|
- Mean = 4.11097
- Std.dev = 2.11058
- 33 items below graph minimum of -1.39
- 664 items above graph maximum of 10.07
|
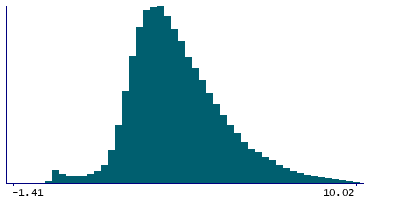
2 Instances
Instance 2 : Imaging visit (2014+)
79,266 participants, 152,676 items
| Maximum | 34.26 |
| Decile 9 | 6.27 |
| Decile 8 | 5.33 |
| Decile 7 | 4.73 |
| Decile 6 | 4.27 |
| Median | 3.88 |
| Decile 4 | 3.53 |
| Decile 3 | 3.2 |
| Decile 2 | 2.86 |
| Decile 1 | 2.42 |
| Minimum | -99 |
|
|
- Mean = 4.11197
- Std.dev = 2.12178
- 27 items below graph minimum of -1.43
- 538 items above graph maximum of 10.12
|
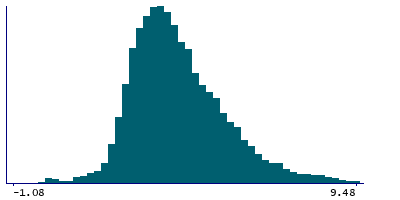
Instance 3 : First repeat imaging visit (2019+)
17,973 participants, 34,986 items
| Maximum | 18.18 |
| Decile 9 | 6.14 |
| Decile 8 | 5.27 |
| Decile 7 | 4.7 |
| Decile 6 | 4.26 |
| Median | 3.88 |
| Decile 4 | 3.56 |
| Decile 3 | 3.24 |
| Decile 2 | 2.9 |
| Decile 1 | 2.48 |
| Minimum | -99 |
|
|
- Mean = 4.10659
- Std.dev = 2.06098
- 6 items below graph minimum of -1.18
- 125 items above graph maximum of 9.8
|
Notes
Cardiac index during PWA. Defined as
cardiac output / body surface area
Note that this field is arrayed to enable representation of the 5 measures of BP acquired during and immediately after the Aortic Distensibility image acquisiton.
1 Related Data-Field
| Field ID | Description | Relationship |
|---|
| 12682 | Cardiac output during PWA - PVR | Current Field is partly derived from Field 12682 |

