Data
197,013 items of data are available, covering 86,451 participants.
Defined-instances run from 2 to 3, labelled using Instancing
2.
Array indices run from 0 to 5.
| Maximum | 3.3 |
| Decile 9 | 0.8 |
| Decile 8 | 0.76 |
| Decile 7 | 0.73 |
| Decile 6 | 0.71 |
| Median | 0.7 |
| Decile 4 | 0.68 |
| Decile 3 | 0.66 |
| Decile 2 | 0.64 |
| Decile 1 | 0.61 |
| Minimum | -3.37 |
|
|
- Mean = 0.697829
- Std.dev = 0.106214
- 2263 items below graph minimum of 0.42
- 1911 items above graph maximum of 0.99
|
2 Instances
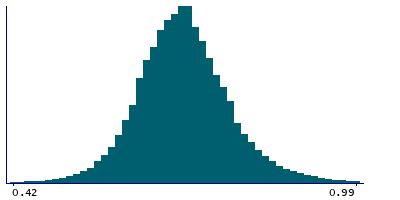
Instance 2 : Imaging visit (2014+)
83,666 participants, 161,409 items
| Maximum | 2.9 |
| Decile 9 | 0.8 |
| Decile 8 | 0.76 |
| Decile 7 | 0.74 |
| Decile 6 | 0.72 |
| Median | 0.7 |
| Decile 4 | 0.68 |
| Decile 3 | 0.66 |
| Decile 2 | 0.64 |
| Decile 1 | 0.61 |
| Minimum | -3.37 |
|

|
- Mean = 0.698788
- Std.dev = 0.108297
- 1975 items below graph minimum of 0.42
- 1659 items above graph maximum of 0.99
|
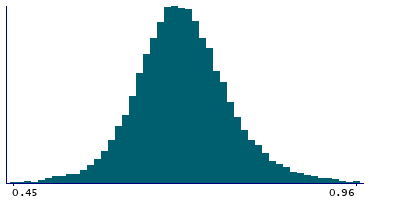
Instance 3 : First repeat imaging visit (2019+)
18,274 participants, 35,604 items
| Maximum | 3.3 |
| Decile 9 | 0.79 |
| Decile 8 | 0.75 |
| Decile 7 | 0.73 |
| Decile 6 | 0.71 |
| Median | 0.69 |
| Decile 4 | 0.68 |
| Decile 3 | 0.66 |
| Decile 2 | 0.64 |
| Decile 1 | 0.61 |
| Minimum | -1.17 |
|
|
- Mean = 0.693481
- Std.dev = 0.0960881
- 302 items below graph minimum of 0.43
- 269 items above graph maximum of 0.97
|
Notes
End systolic pressure index during PWA. Defined as
end systolic pressure / peripheral pulse pressure
Note that this field is arrayed to enable representation of the 5 measures of BP acquired during and immediately after the Aortic Distensibility image acquisiton.
2 Related Data-Fields
| Field ID | Description | Relationship |
|---|
| 12683 | End systolic pressure during PWA - PVR | Current Field is partly derived from Field 12683 |
| 12676 | Peripheral pulse pressure during PWA ... | Current Field is partly derived from Field 12676 |

