Data
208,042 items of data are available, covering 88,345 participants.
Defined-instances run from 2 to 3, labelled using Instancing
2.
Array indices run from 0 to 5.
Units of measurement are percent.
| Maximum | 97 |
| Decile 9 | 31 |
| Decile 8 | 27 |
| Decile 7 | 24 |
| Decile 6 | 22 |
| Median | 20 |
| Decile 4 | 18 |
| Decile 3 | 16 |
| Decile 2 | 13 |
| Decile 1 | 10 |
| Minimum | -98 |
|

|
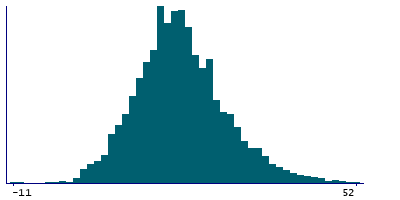
- Mean = 20.1097
- Std.dev = 9.4468
- 875 items below graph minimum of -11
- 594 items above graph maximum of 52
|
2 Instances
Instance 2 : Imaging visit (2014+)
85,733 participants, 170,797 items
| Maximum | 97 |
| Decile 9 | 32 |
| Decile 8 | 27 |
| Decile 7 | 24 |
| Decile 6 | 22 |
| Median | 20 |
| Decile 4 | 18 |
| Decile 3 | 16 |
| Decile 2 | 13 |
| Decile 1 | 9 |
| Minimum | -98 |
|
|
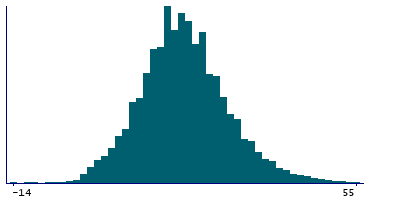
- Mean = 20.151
- Std.dev = 9.64541
- 687 items below graph minimum of -14
- 343 items above graph maximum of 55
|
Instance 3 : First repeat imaging visit (2019+)
18,647 participants, 37,245 items
| Maximum | 91 |
| Decile 9 | 30 |
| Decile 8 | 26 |
| Decile 7 | 23 |
| Decile 6 | 21 |
| Median | 19 |
| Decile 4 | 18 |
| Decile 3 | 16 |
| Decile 2 | 14 |
| Decile 1 | 10 |
| Minimum | -90 |
|
|
- Mean = 19.9203
- Std.dev = 8.47405
- 98 items below graph minimum of -10
- 91 items above graph maximum of 50
|
Notes
Augmentation index for PWA. Defined as
Central augmentation pressure / peripheral pulse pressure
with result expressed as percentage.
Note that this field is arrayed to enable representation of the 5 measures of BP acquired during and immediately after the Aortic Distensibility image acquisiton.
2 Related Data-Fields
| Field ID | Description | Relationship |
|---|
| 12680 | Central augmentation pressure during ... | Current Field is partly derived from Field 12680 |
| 12676 | Peripheral pulse pressure during PWA ... | Current Field is partly derived from Field 12676 |

