Data
205,719 items of data are available, covering 88,065 participants.
Defined-instances run from 2 to 3, labelled using Instancing
2.
Array indices run from 0 to 5.
Units of measurement are mmHg.
| Maximum | 163 |
| Decile 9 | 91 |
| Decile 8 | 81 |
| Decile 7 | 75 |
| Decile 6 | 70 |
| Median | 66 |
| Decile 4 | 62 |
| Decile 3 | 58 |
| Decile 2 | 53 |
| Decile 1 | 47 |
| Minimum | -107 |
|
|
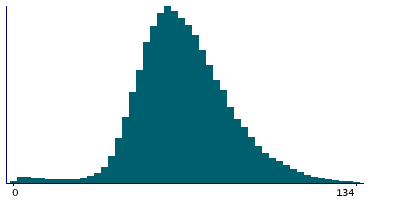
- There are 193 distinct values.
- Mean = 67.2401
- Std.dev = 18.5721
- 143 items below graph minimum of 0
- 211 items above graph maximum of 135
|
2 Instances
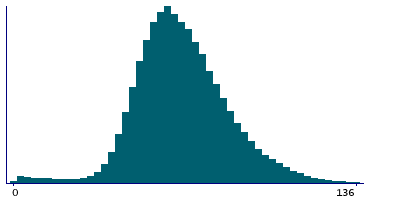
Instance 2 : Imaging visit (2014+)
85,409 participants, 168,943 items
| Maximum | 163 |
| Decile 9 | 91 |
| Decile 8 | 82 |
| Decile 7 | 75 |
| Decile 6 | 70 |
| Median | 66 |
| Decile 4 | 62 |
| Decile 3 | 57 |
| Decile 2 | 53 |
| Decile 1 | 47 |
| Minimum | -107 |
|
|
- There are 190 distinct values.
- Mean = 67.2575
- Std.dev = 18.8123
- 127 items below graph minimum of 0
- 170 items above graph maximum of 135
|
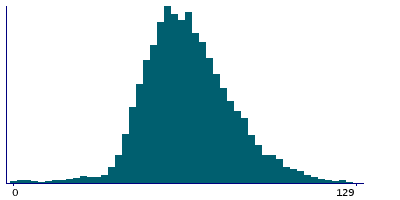
Instance 3 : First repeat imaging visit (2019+)
18,587 participants, 36,776 items
| Maximum | 162 |
| Decile 9 | 89 |
| Decile 8 | 80 |
| Decile 7 | 75 |
| Decile 6 | 70 |
| Median | 66 |
| Decile 4 | 62 |
| Decile 3 | 58 |
| Decile 2 | 54 |
| Decile 1 | 48 |
| Minimum | -56 |
|
|
- There are 158 distinct values.
- Mean = 67.1599
- Std.dev = 17.4262
- 16 items below graph minimum of 0
- 71 items above graph maximum of 130
|
Notes
Central pulse pressure during PWA
0 Related Data-Fields
There are no related data-fields

