Data
205,846 items of data are available, covering 88,079 participants.
Defined-instances run from 2 to 3, labelled using Instancing
2.
Array indices run from 0 to 5.
Units of measurement are mmHg.
| Maximum | 191 |
| Decile 9 | 84 |
| Decile 8 | 79 |
| Decile 7 | 75 |
| Decile 6 | 72 |
| Median | 70 |
| Decile 4 | 67 |
| Decile 3 | 64 |
| Decile 2 | 60 |
| Decile 1 | 55 |
| Minimum | 11 |
|

|
- There are 157 distinct values.
- Mean = 69.4377
- Std.dev = 11.8331
- 221 items above graph maximum of 113
|
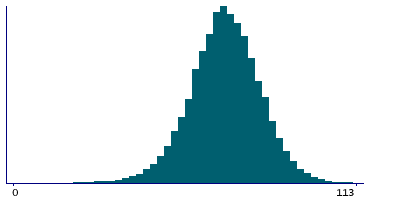
2 Instances
Instance 2 : Imaging visit (2014+)
85,425 participants, 169,049 items
| Maximum | 191 |
| Decile 9 | 84 |
| Decile 8 | 79 |
| Decile 7 | 75 |
| Decile 6 | 72 |
| Median | 70 |
| Decile 4 | 67 |
| Decile 3 | 64 |
| Decile 2 | 60 |
| Decile 1 | 55 |
| Minimum | 11 |
|
|
- There are 153 distinct values.
- Mean = 69.4902
- Std.dev = 12.0293
- 189 items above graph maximum of 113
|
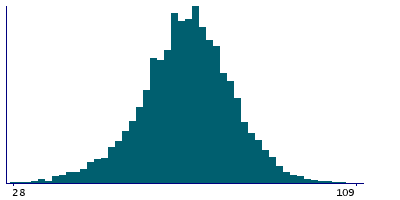
Instance 3 : First repeat imaging visit (2019+)
18,589 participants, 36,797 items
| Maximum | 188 |
| Decile 9 | 82 |
| Decile 8 | 78 |
| Decile 7 | 74 |
| Decile 6 | 72 |
| Median | 69 |
| Decile 4 | 67 |
| Decile 3 | 64 |
| Decile 2 | 61 |
| Decile 1 | 56 |
| Minimum | 14 |
|
|
- There are 108 distinct values.
- Mean = 69.1966
- Std.dev = 10.8833
- 68 items below graph minimum of 30
- 46 items above graph maximum of 108
|
Notes
Diastolic brachial blood pressure during PWA
Note that this field is arrayed to enable representation of the 5 measures of BP acquired during and immediately after the Aortic Distensibility image acquisiton.
0 Related Data-Fields
There are no related data-fields

