Data
208,069 items of data are available, covering 88,344 participants.
Defined-instances run from 2 to 3, labelled using Instancing
2.
Array indices run from 0 to 5.
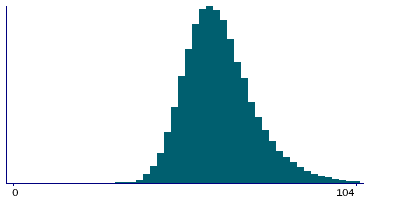
Units of measurement are bpm.
| Maximum | 412 |
| Decile 9 | 77 |
| Decile 8 | 71 |
| Decile 7 | 67 |
| Decile 6 | 64 |
| Median | 61 |
| Decile 4 | 59 |
| Decile 3 | 56 |
| Decile 2 | 54 |
| Decile 1 | 50 |
| Minimum | 18 |
|
|
- There are 142 distinct values.
- Mean = 62.6825
- Std.dev = 11.2009
- 883 items above graph maximum of 104
|
2 Instances
Instance 2 : Imaging visit (2014+)
85,730 participants, 170,845 items
| Maximum | 412 |
| Decile 9 | 77 |
| Decile 8 | 71 |
| Decile 7 | 67 |
| Decile 6 | 64 |
| Median | 62 |
| Decile 4 | 59 |
| Decile 3 | 57 |
| Decile 2 | 54 |
| Decile 1 | 50 |
| Minimum | 19 |
|

|
- There are 138 distinct values.
- Mean = 62.9133
- Std.dev = 11.2584
- 784 items above graph maximum of 104
|
Instance 3 : First repeat imaging visit (2019+)
18,643 participants, 37,224 items
| Maximum | 238 |
| Decile 9 | 75 |
| Decile 8 | 70 |
| Decile 7 | 66 |
| Decile 6 | 63 |
| Median | 60 |
| Decile 4 | 58 |
| Decile 3 | 56 |
| Decile 2 | 53 |
| Decile 1 | 49 |
| Minimum | 18 |
|

|
- There are 116 distinct values.
- Mean = 61.6231
- Std.dev = 10.8703
- 148 items above graph maximum of 101
|
Notes
Heart rate recorded during vicorder run.
Note that this field is arrayed to enable representation of the 5 measures of BP acquired during and immediately after the Aortic Distensibility image acquisiton.
0 Related Data-Fields
There are no related data-fields

