Data
97,052 items of data are available, covering 81,801 participants.
Defined-instances run from 2 to 3, labelled using Instancing
2.
Units of measurement are seconds.
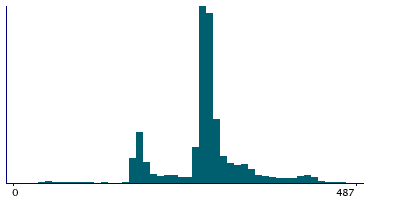
| Maximum | 1378 |
| Decile 9 | 330 |
| Decile 8 | 293 |
| Decile 7 | 280 |
| Decile 6 | 275 |
| Median | 271 |
| Decile 4 | 266 |
| Decile 3 | 225 |
| Decile 2 | 184 |
| Decile 1 | 176 |
| Minimum | 3 |
|
|
- There are 632 distinct values.
- Mean = 258.109
- Std.dev = 66.7754
- 289 items above graph maximum of 484
|
2 Instances
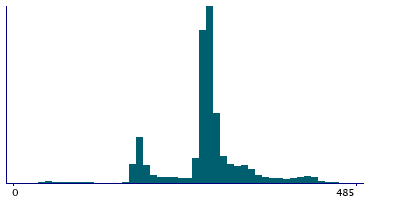
Instance 2 : Imaging visit (2014+)
79,676 participants, 79,676 items
| Maximum | 1378 |
| Decile 9 | 332 |
| Decile 8 | 297 |
| Decile 7 | 282 |
| Decile 6 | 277 |
| Median | 273 |
| Decile 4 | 269 |
| Decile 3 | 264 |
| Decile 2 | 196 |
| Decile 1 | 177 |
| Minimum | 3 |
|
|
- There are 625 distinct values.
- Mean = 264.987
- Std.dev = 65.2243
- 256 items above graph maximum of 487
|
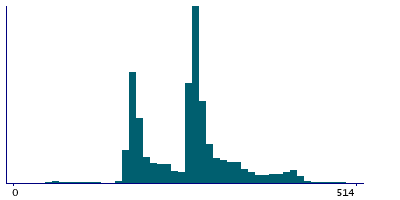
Instance 3 : First repeat imaging visit (2019+)
17,376 participants, 17,376 items
| Maximum | 888 |
| Decile 9 | 309 |
| Decile 8 | 276 |
| Decile 7 | 266 |
| Decile 6 | 230 |
| Median | 204 |
| Decile 4 | 187 |
| Decile 3 | 181 |
| Decile 2 | 177 |
| Decile 1 | 173 |
| Minimum | 16 |
|
|
- There are 451 distinct values.
- Mean = 226.573
- Std.dev = 64.7025
- 54 items above graph maximum of 445
|
Notes
This is the length of time that the eprime test was administered for.
0 Related Data-Fields
There are no related data-fields
0 Resources
There are no matching Resources
2 Applications
| Application ID | Title |
|---|
| 17689 | Genetic, environmental and lifestyle predictors of brain/cognitive-related outcomes. |
| 22783 | The joint analysis of imaging data and genetic data for early tumor detection, prevention, diagnosis and treatment |
