Data
643,201 items of data are available, covering 501,091 participants.
Some values have special meanings defined by Data-Coding
100291.
Defined-instances run from 0 to 3, labelled using Instancing
2.
Units of measurement are hours/day.
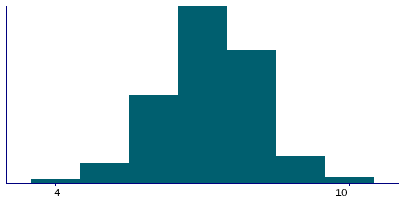
| Maximum | 23 |
| Decile 9 | 8 |
| Decile 8 | 8 |
| Decile 7 | 8 |
| Decile 6 | 7 |
| Median | 7 |
| Decile 4 | 7 |
| Decile 3 | 7 |
| Decile 2 | 6 |
| Decile 1 | 6 |
| Minimum | 1 |
|
|
- There are 23 distinct values.
- Mean = 7.15711
- Std.dev = 1.10146
- 1223 items below graph minimum of 4
- 2498 items above graph maximum of 10
- 412 items have value -3 (Prefer not to answer)
- 3374 items have value -1 (Do not know)
|
4 Instances
Instance 0 : Initial assessment visit (2006-2010) at which participants were recruited and consent given
501,050 participants, 501,050 items
| Maximum | 23 |
| Decile 9 | 8 |
| Decile 8 | 8 |
| Decile 7 | 8 |
| Decile 6 | 7 |
| Median | 7 |
| Decile 4 | 7 |
| Decile 3 | 7 |
| Decile 2 | 6 |
| Decile 1 | 6 |
| Minimum | 1 |
|

|
- There are 23 distinct values.
- Mean = 7.15424
- Std.dev = 1.11147
- 1056 items below graph minimum of 4
- 2145 items above graph maximum of 10
- 384 items have value -3 (Prefer not to answer)
- 2939 items have value -1 (Do not know)
|
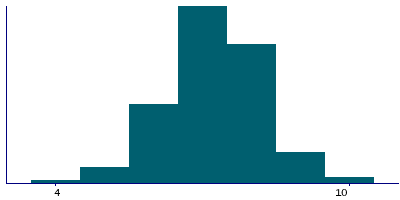
Instance 1 : First repeat assessment visit (2012-13)
20,314 participants, 20,314 items
| Maximum | 16 |
| Decile 9 | 8 |
| Decile 8 | 8 |
| Decile 7 | 8 |
| Decile 6 | 7 |
| Median | 7 |
| Decile 4 | 7 |
| Decile 3 | 7 |
| Decile 2 | 6 |
| Decile 1 | 6 |
| Minimum | 1 |
|
|
- There are 16 distinct values.
- Mean = 7.23471
- Std.dev = 1.05836
- 26 items below graph minimum of 4
- 62 items above graph maximum of 10
- 4 items have value -3 (Prefer not to answer)
- 55 items have value -1 (Do not know)
|
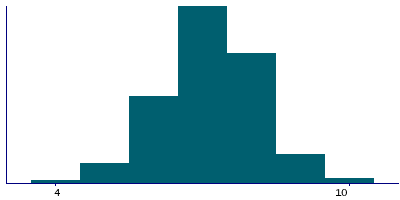
Instance 2 : Imaging visit (2014+)
100,917 participants, 100,917 items
| Maximum | 18 |
| Decile 9 | 8 |
| Decile 8 | 8 |
| Decile 7 | 8 |
| Decile 6 | 7 |
| Median | 7 |
| Decile 4 | 7 |
| Decile 3 | 7 |
| Decile 2 | 6 |
| Decile 1 | 6 |
| Minimum | 1 |
|
|
- There are 17 distinct values.
- Mean = 7.15027
- Std.dev = 1.06277
- 119 items below graph minimum of 4
- 229 items above graph maximum of 10
- 23 items have value -3 (Prefer not to answer)
- 310 items have value -1 (Do not know)
|
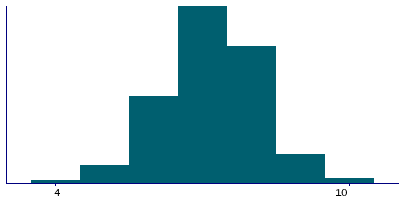
Instance 3 : First repeat imaging visit (2019+)
20,920 participants, 20,920 items
| Maximum | 16 |
| Decile 9 | 8 |
| Decile 8 | 8 |
| Decile 7 | 8 |
| Decile 6 | 7 |
| Median | 7 |
| Decile 4 | 7 |
| Decile 3 | 7 |
| Decile 2 | 6 |
| Decile 1 | 6 |
| Minimum | 2 |
|
|
- There are 15 distinct values.
- Mean = 7.18332
- Std.dev = 1.08238
- 22 items below graph minimum of 4
- 62 items above graph maximum of 10
- 1 items have value -3 (Prefer not to answer)
- 70 items have value -1 (Do not know)
|
Notes
ACE touchscreen question "About how many hours sleep do you get in every 24 hours? (please include naps)"
The following checks were performed:
- If answer < 1 then rejected
- If answer > 23 then rejected
- If answer < 3 then participant asked to confirm
- If answer > 12 then participant asked to confirm
If the participant activated the Help button they were shown the message:
If the time you spend sleeping varies a lot, give the
average time for a 24 hour day in the last 4 weeks.
|
Coding 100291 defines 2 special values:
- -1 represents "Do not know"
- -3 represents "Prefer not to answer"
0 Related Data-Fields
There are no related data-fields


