Data
457,988 items of data are available, covering 210,751 participants.
Defined-instances run from 0 to 4, labelled using Instancing
1.
Units of measurement are mg.
| Maximum | 8086.33 |
| Decile 9 | 1486.89 |
| Decile 8 | 1252.48 |
| Decile 7 | 1112.28 |
| Decile 6 | 1005.63 |
| Median | 913.74 |
| Decile 4 | 827.47 |
| Decile 3 | 741.36 |
| Decile 2 | 647 |
| Decile 1 | 527.5 |
| Minimum | 0 |
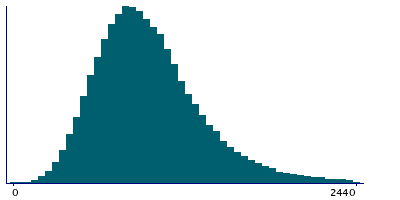
|
|
- Mean = 982.051
- Std.dev = 447.806
- 4775 items above graph maximum of 2446.27
|
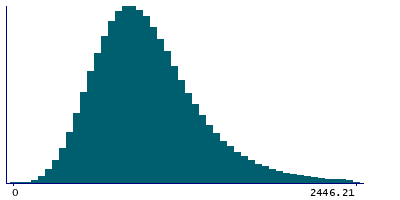
5 Instances
Instance 0 : Conducted in assessment centre, April 2009 to September 2010.
70,663 participants, 70,663 items
| Maximum | 8011.52 |
| Decile 9 | 1507.97 |
| Decile 8 | 1264.45 |
| Decile 7 | 1120.5 |
| Decile 6 | 1009.33 |
| Median | 914.94 |
| Decile 4 | 825.205 |
| Decile 3 | 736.63 |
| Decile 2 | 639.31 |
| Decile 1 | 514.945 |
| Minimum | 0 |
|
|
- Mean = 987.107
- Std.dev = 470.301
- 807 items above graph maximum of 2500.98
|
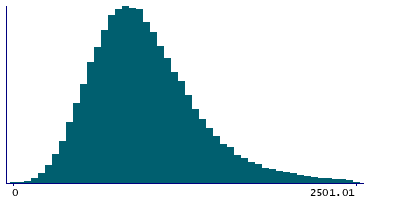
Instance 1 : On-line cycle 1, February 2011 to April 2011.
100,445 participants, 100,445 items
| Maximum | 7033.75 |
| Decile 9 | 1498.42 |
| Decile 8 | 1265.24 |
| Decile 7 | 1125.36 |
| Decile 6 | 1017.74 |
| Median | 926.09 |
| Decile 4 | 838.95 |
| Decile 3 | 751.915 |
| Decile 2 | 657.58 |
| Decile 1 | 537.56 |
| Minimum | 0 |
|
|
- Mean = 992.454
- Std.dev = 445.142
- 985 items above graph maximum of 2459.28
|
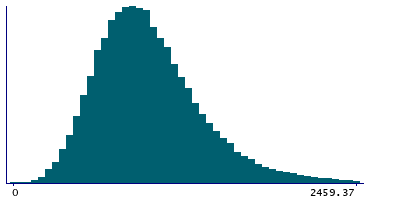
Instance 2 : On-line cycle 2, June 2011 to September 2011.
83,139 participants, 83,139 items
| Maximum | 8086.33 |
| Decile 9 | 1462.77 |
| Decile 8 | 1230.47 |
| Decile 7 | 1093.37 |
| Decile 6 | 989.3 |
| Median | 899.295 |
| Decile 4 | 815.165 |
| Decile 3 | 730.8 |
| Decile 2 | 640.695 |
| Decile 1 | 523.63 |
| Minimum | 0 |
|
|
- Mean = 968.154
- Std.dev = 442.06
- 924 items above graph maximum of 2401.91
|
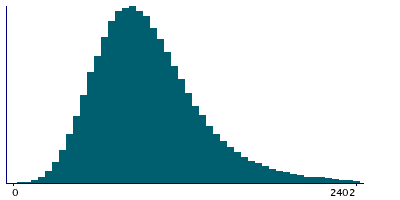
Instance 3 : On-line cycle 3, October 2011 to December 2011.
103,614 participants, 103,614 items
| Maximum | 7172.47 |
| Decile 9 | 1481.2 |
| Decile 8 | 1247.64 |
| Decile 7 | 1107.29 |
| Decile 6 | 1001.33 |
| Median | 909.77 |
| Decile 4 | 824.24 |
| Decile 3 | 738.155 |
| Decile 2 | 643.305 |
| Decile 1 | 524.675 |
| Minimum | 0 |
|

|
- Mean = 976.433
- Std.dev = 439.73
- 1010 items above graph maximum of 2437.72
|
Instance 4 : On-line cycle 4, April 2012 to June 2012.
100,127 participants, 100,127 items
| Maximum | 7705.8 |
| Decile 9 | 1486.59 |
| Decile 8 | 1253.59 |
| Decile 7 | 1113.03 |
| Decile 6 | 1009.75 |
| Median | 916.985 |
| Decile 4 | 831.055 |
| Decile 3 | 746.77 |
| Decile 2 | 652.14 |
| Decile 1 | 533.255 |
| Minimum | 0 |
|
|
- Mean = 985.4
- Std.dev = 446.846
- 1047 items above graph maximum of 2439.92
|

