Data
457,988 items of data are available, covering 210,751 participants.
Defined-instances run from 0 to 4, labelled using Instancing
1.
Units of measurement are ug.
| Maximum | 48.59 |
| Decile 9 | 8.81 |
| Decile 8 | 4.06 |
| Decile 7 | 2.88 |
| Decile 6 | 2.21 |
| Median | 1.76 |
| Decile 4 | 1.35 |
| Decile 3 | 1.02 |
| Decile 2 | 0.7 |
| Decile 1 | 0.36 |
| Minimum | 0 |
|

|
- Mean = 2.89057
- Std.dev = 3.35357
- 4175 items above graph maximum of 17.26
|
5 Instances
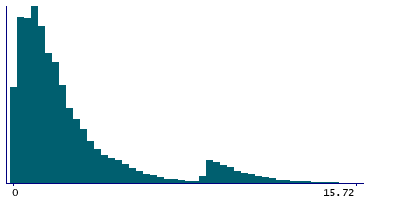
Instance 0 : Conducted in assessment centre, April 2009 to September 2010.
70,663 participants, 70,663 items
| Maximum | 48.59 |
| Decile 9 | 8.015 |
| Decile 8 | 3.87 |
| Decile 7 | 2.77 |
| Decile 6 | 2.12 |
| Median | 1.67 |
| Decile 4 | 1.28 |
| Decile 3 | 0.96 |
| Decile 2 | 0.63 |
| Decile 1 | 0.31 |
| Minimum | 0 |
|
|
- Mean = 2.78648
- Std.dev = 3.33836
- 662 items above graph maximum of 15.72
|
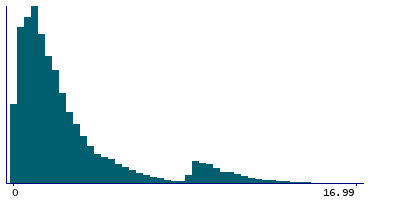
Instance 1 : On-line cycle 1, February 2011 to April 2011.
100,445 participants, 100,445 items
| Maximum | 46.32 |
| Decile 9 | 8.675 |
| Decile 8 | 4.03 |
| Decile 7 | 2.87 |
| Decile 6 | 2.21 |
| Median | 1.75 |
| Decile 4 | 1.34 |
| Decile 3 | 1.01 |
| Decile 2 | 0.7 |
| Decile 1 | 0.36 |
| Minimum | 0 |
|
|
- Mean = 2.87216
- Std.dev = 3.32157
- 865 items above graph maximum of 16.99
|
Instance 2 : On-line cycle 2, June 2011 to September 2011.
83,139 participants, 83,139 items
| Maximum | 44.64 |
| Decile 9 | 8.91 |
| Decile 8 | 4.23 |
| Decile 7 | 2.96 |
| Decile 6 | 2.27 |
| Median | 1.81 |
| Decile 4 | 1.39 |
| Decile 3 | 1.05 |
| Decile 2 | 0.72 |
| Decile 1 | 0.39 |
| Minimum | 0 |
|

|
- Mean = 2.98395
- Std.dev = 3.45401
- 885 items above graph maximum of 17.43
|
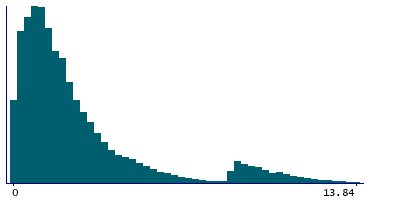
Instance 3 : On-line cycle 3, October 2011 to December 2011.
103,614 participants, 103,614 items
| Maximum | 44.12 |
| Decile 9 | 7.1 |
| Decile 8 | 3.84 |
| Decile 7 | 2.79 |
| Decile 6 | 2.16 |
| Median | 1.72 |
| Decile 4 | 1.33 |
| Decile 3 | 1 |
| Decile 2 | 0.69 |
| Decile 1 | 0.36 |
| Minimum | 0 |
|
|
- Mean = 2.77426
- Std.dev = 3.19287
- 1033 items above graph maximum of 13.84
|
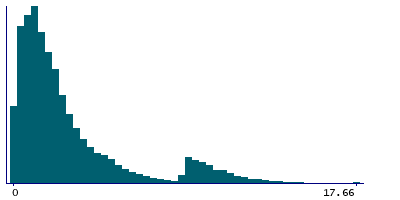
Instance 4 : On-line cycle 4, April 2012 to June 2012.
100,127 participants, 100,127 items
| Maximum | 45.43 |
| Decile 9 | 9.02 |
| Decile 8 | 4.33 |
| Decile 7 | 3.01 |
| Decile 6 | 2.3 |
| Median | 1.82 |
| Decile 4 | 1.4 |
| Decile 3 | 1.06 |
| Decile 2 | 0.73 |
| Decile 1 | 0.38 |
| Minimum | 0 |
|
|
- Mean = 3.0253
- Std.dev = 3.46497
- 939 items above graph maximum of 17.66
|

