Data
457,988 items of data are available, covering 210,751 participants.
Defined-instances run from 0 to 4, labelled using Instancing
1.
Units of measurement are mg.
| Maximum | 32298.2 |
| Decile 9 | 5364.27 |
| Decile 8 | 4666.03 |
| Decile 7 | 4237.04 |
| Decile 6 | 3900.87 |
| Median | 3602.88 |
| Decile 4 | 3320.48 |
| Decile 3 | 3028.72 |
| Decile 2 | 2701.34 |
| Decile 1 | 2271.01 |
| Minimum | 0 |
|

|
- Mean = 3779.6
- Std.dev = 1463.72
- 4663 items above graph maximum of 8457.54
|
5 Instances
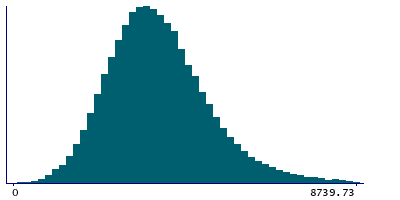
Instance 0 : Conducted in assessment centre, April 2009 to September 2010.
70,663 participants, 70,663 items
| Maximum | 30634.8 |
| Decile 9 | 5459.62 |
| Decile 8 | 4716.02 |
| Decile 7 | 4260.57 |
| Decile 6 | 3908.04 |
| Median | 3589.17 |
| Decile 4 | 3286.34 |
| Decile 3 | 2980.83 |
| Decile 2 | 2636.24 |
| Decile 1 | 2179.78 |
| Minimum | 0 |
|
|
- Mean = 3780.02
- Std.dev = 1559.63
- 756 items above graph maximum of 8739.47
|
Instance 1 : On-line cycle 1, February 2011 to April 2011.
100,445 participants, 100,445 items
| Maximum | 25757.3 |
| Decile 9 | 5366.54 |
| Decile 8 | 4680.61 |
| Decile 7 | 4255.17 |
| Decile 6 | 3923.19 |
| Median | 3630.01 |
| Decile 4 | 3346.54 |
| Decile 3 | 3054.56 |
| Decile 2 | 2732.46 |
| Decile 1 | 2305.63 |
| Minimum | 0 |
|

|
- Mean = 3798.32
- Std.dev = 1444.57
- 1001 items above graph maximum of 8427.45
|
Instance 2 : On-line cycle 2, June 2011 to September 2011.
83,139 participants, 83,139 items
| Maximum | 32298.2 |
| Decile 9 | 5387.73 |
| Decile 8 | 4693.59 |
| Decile 7 | 4259.53 |
| Decile 6 | 3925.12 |
| Median | 3621.62 |
| Decile 4 | 3342.57 |
| Decile 3 | 3053.07 |
| Decile 2 | 2722.07 |
| Decile 1 | 2286.11 |
| Minimum | 0 |
|

|
- Mean = 3802.72
- Std.dev = 1467.7
- 837 items above graph maximum of 8489.35
|
Instance 3 : On-line cycle 3, October 2011 to December 2011.
103,614 participants, 103,614 items
| Maximum | 24940.6 |
| Decile 9 | 5301.63 |
| Decile 8 | 4619.48 |
| Decile 7 | 4195.83 |
| Decile 6 | 3863.82 |
| Median | 3569 |
| Decile 4 | 3290.26 |
| Decile 3 | 3006.56 |
| Decile 2 | 2688.68 |
| Decile 1 | 2271.89 |
| Minimum | 0 |
|

|
- Mean = 3743.95
- Std.dev = 1422.5
- 1039 items above graph maximum of 8331.37
|
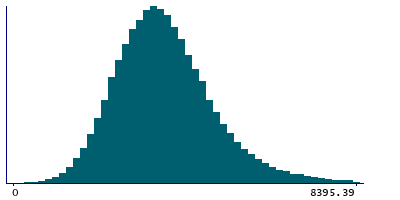
Instance 4 : On-line cycle 4, April 2012 to June 2012.
100,127 participants, 100,127 items
| Maximum | 26038.7 |
| Decile 9 | 5343.07 |
| Decile 8 | 4644.81 |
| Decile 7 | 4224.27 |
| Decile 6 | 3894.38 |
| Median | 3603.43 |
| Decile 4 | 3327.01 |
| Decile 3 | 3037.53 |
| Decile 2 | 2712.53 |
| Decile 1 | 2290.48 |
| Minimum | 0 |
|
|
- Mean = 3778.21
- Std.dev = 1450.87
- 1020 items above graph maximum of 8395.66
|

