Data
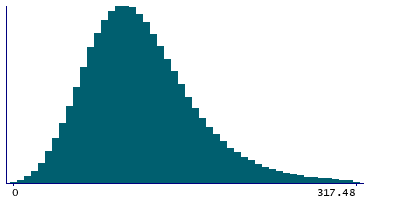
457,988 items of data are available, covering 210,751 participants.
Defined-instances run from 0 to 4, labelled using Instancing
1.
Units of measurement are g.
| Maximum | 1342.33 |
| Decile 9 | 188.49 |
| Decile 8 | 158.07 |
| Decile 7 | 139.56 |
| Decile 6 | 125.19 |
| Median | 112.71 |
| Decile 4 | 100.93 |
| Decile 3 | 89.07 |
| Decile 2 | 76.09 |
| Decile 1 | 59.48 |
| Minimum | 0 |
|
|
- Mean = 120.63
- Std.dev = 57.1422
- 3615 items above graph maximum of 317.5
|
5 Instances
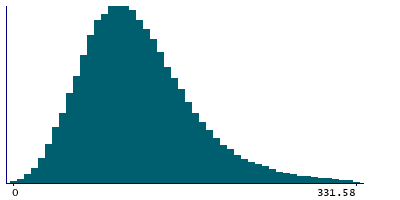
Instance 0 : Conducted in assessment centre, April 2009 to September 2010.
70,663 participants, 70,663 items
| Maximum | 1342.33 |
| Decile 9 | 195.07 |
| Decile 8 | 162.55 |
| Decile 7 | 142.64 |
| Decile 6 | 127.515 |
| Median | 114.22 |
| Decile 4 | 101.73 |
| Decile 3 | 89.34 |
| Decile 2 | 75.86 |
| Decile 1 | 58.57 |
| Minimum | 0 |
|
|
- Mean = 123.245
- Std.dev = 61.9828
- 600 items above graph maximum of 331.57
|
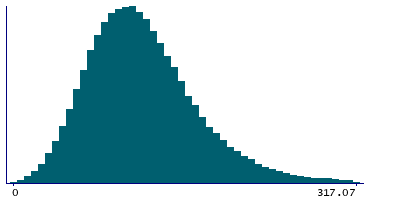
Instance 1 : On-line cycle 1, February 2011 to April 2011.
100,445 participants, 100,445 items
| Maximum | 755.95 |
| Decile 9 | 188.655 |
| Decile 8 | 158.65 |
| Decile 7 | 140.37 |
| Decile 6 | 126 |
| Median | 113.66 |
| Decile 4 | 101.93 |
| Decile 3 | 89.95 |
| Decile 2 | 76.95 |
| Decile 1 | 60.22 |
| Minimum | 0 |
|
|
- Mean = 121.168
- Std.dev = 56.2496
- 757 items above graph maximum of 317.09
|
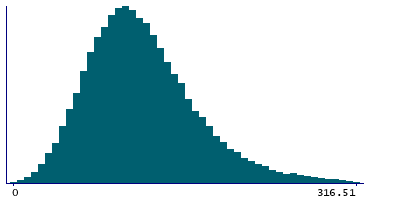
Instance 2 : On-line cycle 2, June 2011 to September 2011.
83,139 participants, 83,139 items
| Maximum | 1239.45 |
| Decile 9 | 188.415 |
| Decile 8 | 158.025 |
| Decile 7 | 139.55 |
| Decile 6 | 125.32 |
| Median | 112.975 |
| Decile 4 | 101.43 |
| Decile 3 | 89.81 |
| Decile 2 | 76.73 |
| Decile 1 | 60.3 |
| Minimum | 0 |
|
|
- Mean = 120.95
- Std.dev = 56.7724
- 673 items above graph maximum of 316.53
|
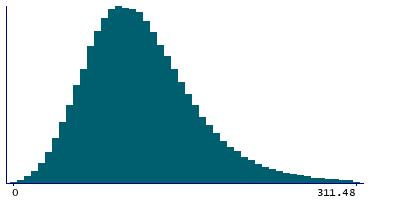
Instance 3 : On-line cycle 3, October 2011 to December 2011.
103,614 participants, 103,614 items
| Maximum | 784.1 |
| Decile 9 | 184.95 |
| Decile 8 | 155.52 |
| Decile 7 | 137.41 |
| Decile 6 | 123.23 |
| Median | 111 |
| Decile 4 | 99.195 |
| Decile 3 | 87.58 |
| Decile 2 | 74.82 |
| Decile 1 | 58.43 |
| Minimum | 0 |
|
|
- Mean = 118.516
- Std.dev = 55.443
- 787 items above graph maximum of 311.47
|
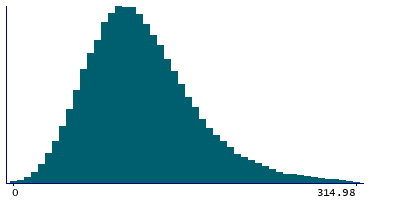
Instance 4 : On-line cycle 4, April 2012 to June 2012.
100,127 participants, 100,127 items
| Maximum | 1276.38 |
| Decile 9 | 187.4 |
| Decile 8 | 157.24 |
| Decile 7 | 138.915 |
| Decile 6 | 124.67 |
| Median | 112.34 |
| Decile 4 | 100.73 |
| Decile 3 | 89.17 |
| Decile 2 | 76.25 |
| Decile 1 | 59.83 |
| Minimum | 0 |
|
|
- Mean = 120.166
- Std.dev = 56.4158
- 771 items above graph maximum of 314.97
|


