Data
457,988 items of data are available, covering 210,751 participants.
Defined-instances run from 0 to 4, labelled using Instancing
1.
Units of measurement are g.
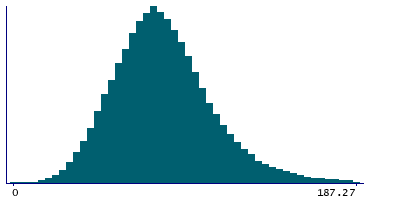
| Maximum | 801.85 |
| Decile 9 | 118.01 |
| Decile 8 | 102.72 |
| Decile 7 | 93.31 |
| Decile 6 | 85.98 |
| Median | 79.49 |
| Decile 4 | 73.24 |
| Decile 3 | 66.69 |
| Decile 2 | 59.06 |
| Decile 1 | 48.79 |
| Minimum | 0 |
|
|
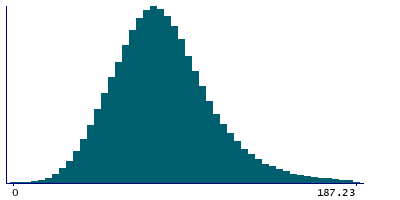
- Mean = 82.4133
- Std.dev = 29.7201
- 2968 items above graph maximum of 187.23
|
5 Instances
Instance 0 : Conducted in assessment centre, April 2009 to September 2010.
70,663 participants, 70,663 items
| Maximum | 801.85 |
| Decile 9 | 118.86 |
| Decile 8 | 102.91 |
| Decile 7 | 93.1 |
| Decile 6 | 85.43 |
| Median | 78.62 |
| Decile 4 | 72.05 |
| Decile 3 | 65.3 |
| Decile 2 | 57.33 |
| Decile 1 | 46.72 |
| Minimum | 0 |
|
|
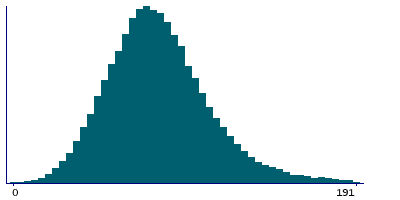
- Mean = 81.8008
- Std.dev = 31.3254
- 498 items above graph maximum of 191
|
Instance 1 : On-line cycle 1, February 2011 to April 2011.
100,445 participants, 100,445 items
| Maximum | 636.08 |
| Decile 9 | 117.91 |
| Decile 8 | 102.94 |
| Decile 7 | 93.7 |
| Decile 6 | 86.53 |
| Median | 80.1 |
| Decile 4 | 73.92 |
| Decile 3 | 67.4 |
| Decile 2 | 59.83 |
| Decile 1 | 49.65 |
| Minimum | 0 |
|
|
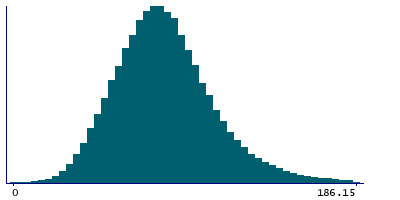
- Mean = 82.8797
- Std.dev = 29.2652
- 625 items above graph maximum of 186.17
|
Instance 2 : On-line cycle 2, June 2011 to September 2011.
83,139 participants, 83,139 items
| Maximum | 792.06 |
| Decile 9 | 118.245 |
| Decile 8 | 102.81 |
| Decile 7 | 93.26 |
| Decile 6 | 85.86 |
| Median | 79.43 |
| Decile 4 | 73.14 |
| Decile 3 | 66.6 |
| Decile 2 | 59.11 |
| Decile 1 | 48.9 |
| Minimum | 0 |
|

|
- Mean = 82.4999
- Std.dev = 29.9797
- 581 items above graph maximum of 187.59
|
Instance 3 : On-line cycle 3, October 2011 to December 2011.
103,614 participants, 103,614 items
| Maximum | 565.45 |
| Decile 9 | 117.08 |
| Decile 8 | 102.125 |
| Decile 7 | 92.92 |
| Decile 6 | 85.75 |
| Median | 79.36 |
| Decile 4 | 73.26 |
| Decile 3 | 66.74 |
| Decile 2 | 59.23 |
| Decile 1 | 48.975 |
| Minimum | 0 |
|
|
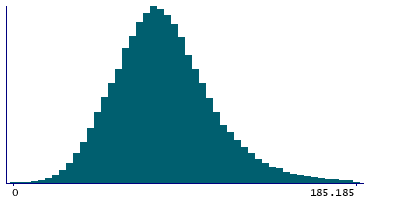
- Mean = 82.0687
- Std.dev = 28.8503
- 615 items above graph maximum of 185.185
|
Instance 4 : On-line cycle 4, April 2012 to June 2012.
100,127 participants, 100,127 items
| Maximum | 665.63 |
| Decile 9 | 118.18 |
| Decile 8 | 102.88 |
| Decile 7 | 93.49 |
| Decile 6 | 86.14 |
| Median | 79.61 |
| Decile 4 | 73.465 |
| Decile 3 | 66.94 |
| Decile 2 | 59.31 |
| Decile 1 | 49.12 |
| Minimum | 0 |
|
|
- Mean = 82.6622
- Std.dev = 29.6686
- 657 items above graph maximum of 187.24
|

