Data
457,988 items of data are available, covering 210,751 participants.
Defined-instances run from 0 to 4, labelled using Instancing
1.
Units of measurement are KJ.
| Maximum | 78205.7 |
| Decile 9 | 12487.2 |
| Decile 8 | 10899.6 |
| Decile 7 | 9904.63 |
| Decile 6 | 9125.73 |
| Median | 8461.42 |
| Decile 4 | 7829.71 |
| Decile 3 | 7194.53 |
| Decile 2 | 6487.39 |
| Decile 1 | 5551.5 |
| Minimum | 0 |
|
|
- Mean = 8845.32
- Std.dev = 3032.86
- 3256 items above graph maximum of 19422.8
|
5 Instances
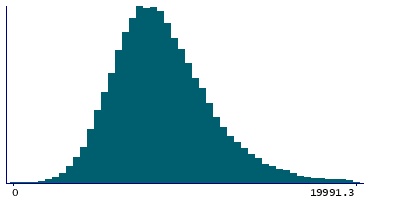
Instance 0 : Conducted in assessment centre, April 2009 to September 2010.
70,663 participants, 70,663 items
| Maximum | 78205.7 |
| Decile 9 | 12669.7 |
| Decile 8 | 10973.5 |
| Decile 7 | 9921.01 |
| Decile 6 | 9100.85 |
| Median | 8405.03 |
| Decile 4 | 7740.12 |
| Decile 3 | 7080.66 |
| Decile 2 | 6339.06 |
| Decile 1 | 5347.48 |
| Minimum | 0 |
|
|
- Mean = 8825.86
- Std.dev = 3229.57
- 553 items above graph maximum of 19991.9
|
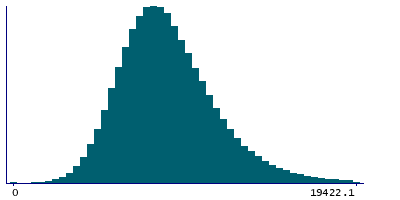
Instance 1 : On-line cycle 1, February 2011 to April 2011.
100,445 participants, 100,445 items
| Maximum | 47523.7 |
| Decile 9 | 12447.3 |
| Decile 8 | 10905.6 |
| Decile 7 | 9924.94 |
| Decile 6 | 9153.63 |
| Median | 8499.27 |
| Decile 4 | 7872.98 |
| Decile 3 | 7243.94 |
| Decile 2 | 6539.2 |
| Decile 1 | 5623.54 |
| Minimum | 0 |
|

|
- Mean = 8869.84
- Std.dev = 2979.48
- 675 items above graph maximum of 19271.1
|
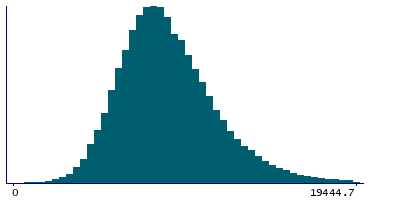
Instance 2 : On-line cycle 2, June 2011 to September 2011.
83,139 participants, 83,139 items
| Maximum | 68418.5 |
| Decile 9 | 12520.2 |
| Decile 8 | 10914.6 |
| Decile 7 | 9919.78 |
| Decile 6 | 9141.93 |
| Median | 8463.45 |
| Decile 4 | 7841.39 |
| Decile 3 | 7212.37 |
| Decile 2 | 6519.43 |
| Decile 1 | 5593.88 |
| Minimum | 0 |
|
|
- Mean = 8865.66
- Std.dev = 3023.93
- 577 items above graph maximum of 19446.5
|
Instance 3 : On-line cycle 3, October 2011 to December 2011.
103,614 participants, 103,614 items
| Maximum | 51266.1 |
| Decile 9 | 12379.2 |
| Decile 8 | 10811.8 |
| Decile 7 | 9834.44 |
| Decile 6 | 9069.18 |
| Median | 8421.99 |
| Decile 4 | 7799.15 |
| Decile 3 | 7156.94 |
| Decile 2 | 6456.72 |
| Decile 1 | 5537.85 |
| Minimum | 0 |
|

|
- Mean = 8782.86
- Std.dev = 2950.86
- 666 items above graph maximum of 19220.5
|
Instance 4 : On-line cycle 4, April 2012 to June 2012.
100,127 participants, 100,127 items
| Maximum | 60976.3 |
| Decile 9 | 12502.8 |
| Decile 8 | 10920 |
| Decile 7 | 9934.13 |
| Decile 6 | 9164.38 |
| Median | 8500.85 |
| Decile 4 | 7875.55 |
| Decile 3 | 7240.17 |
| Decile 2 | 6535.32 |
| Decile 1 | 5599.39 |
| Minimum | 0 |
|

|
- Mean = 8882.22
- Std.dev = 3032.63
- 747 items above graph maximum of 19406.2
|

