Data
616,967 items of data are available, covering 481,082 participants.
Some values have special meanings defined by Data-Coding
100291.
Defined-instances run from 0 to 3, labelled using Instancing
2.
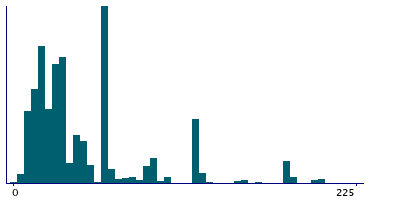
Units of measurement are minutes/day.
| Maximum | 1440 |
| Decile 9 | 120 |
| Decile 8 | 80 |
| Decile 7 | 60 |
| Decile 6 | 45 |
| Median | 30 |
| Decile 4 | 30 |
| Decile 3 | 25 |
| Decile 2 | 20 |
| Decile 1 | 15 |
| Minimum | 0 |
|

|
- There are 314 distinct values.
- Mean = 60.946
- Std.dev = 75.0851
- 26058 items above graph maximum of 225
- 676 items have value -3 (Prefer not to answer)
- 61181 items have value -1 (Do not know)
|
4 Instances
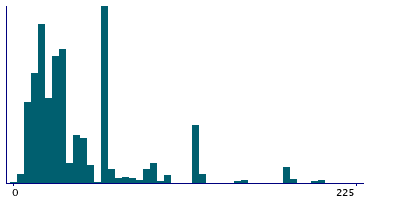
Instance 0 : Initial assessment visit (2006-2010) at which participants were recruited and consent given
477,339 participants, 477,339 items
| Maximum | 1440 |
| Decile 9 | 120 |
| Decile 8 | 75 |
| Decile 7 | 60 |
| Decile 6 | 45 |
| Median | 30 |
| Decile 4 | 30 |
| Decile 3 | 20 |
| Decile 2 | 20 |
| Decile 1 | 15 |
| Minimum | 0 |
|
|
- There are 293 distinct values.
- Mean = 61.6478
- Std.dev = 78.8041
- 22048 items above graph maximum of 225
- 576 items have value -3 (Prefer not to answer)
- 51663 items have value -1 (Do not know)
|
Instance 1 : First repeat assessment visit (2012-13)
19,672 participants, 19,672 items
| Maximum | 720 |
| Decile 9 | 120 |
| Decile 8 | 60 |
| Decile 7 | 60 |
| Decile 6 | 40 |
| Median | 30 |
| Decile 4 | 30 |
| Decile 3 | 20 |
| Decile 2 | 20 |
| Decile 1 | 15 |
| Minimum | 0 |
|
|
- There are 102 distinct values.
- Mean = 50.2462
- Std.dev = 56.4639
- 506 items above graph maximum of 225
- 13 items have value -3 (Prefer not to answer)
- 1494 items have value -1 (Do not know)
|
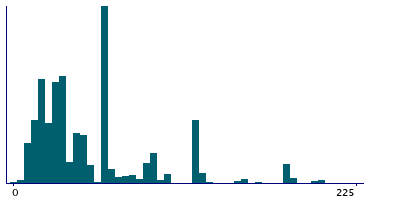
Instance 2 : Imaging visit (2014+)
99,298 participants, 99,298 items
| Maximum | 1400 |
| Decile 9 | 120 |
| Decile 8 | 85 |
| Decile 7 | 60 |
| Decile 6 | 60 |
| Median | 40 |
| Decile 4 | 30 |
| Decile 3 | 30 |
| Decile 2 | 20 |
| Decile 1 | 15 |
| Minimum | 0 |
|
|
- There are 188 distinct values.
- Mean = 59.5567
- Std.dev = 62.4964
- 2914 items above graph maximum of 225
- 74 items have value -3 (Prefer not to answer)
- 6747 items have value -1 (Do not know)
|
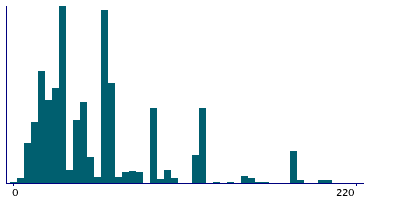
Instance 3 : First repeat imaging visit (2019+)
20,658 participants, 20,658 items
| Maximum | 1000 |
| Decile 9 | 120 |
| Decile 8 | 90 |
| Decile 7 | 60 |
| Decile 6 | 60 |
| Median | 45 |
| Decile 4 | 30 |
| Decile 3 | 30 |
| Decile 2 | 20 |
| Decile 1 | 20 |
| Minimum | 0 |
|
|
- There are 99 distinct values.
- Mean = 62.2128
- Std.dev = 59.2806
- 591 items above graph maximum of 220
- 13 items have value -3 (Prefer not to answer)
- 1277 items have value -1 (Do not know)
|
Notes
ACE touchscreen question "How many minutes did you usually spend walking on a typical DAY?"
The following checks were performed:
- If answer < 0 then rejected
- If answer > 1440 then rejected
- If answer < 10 then participant asked to confirm
- If answer > 300 then participant asked to confirm
If the participant activated the Help button they were shown the message:
Count the number of minutes that you usually spend walking in one day.
If the time you usually spend walking on each day of the week varies a
lot, give an average of the time you spend walking. For instance if on
one day of the week you usually walk for 4 hours but on the other day
you walk 2 hours then give the average - that is 3 hours.
|
Field 874 was collected from participants who indicated that they walked for 10 minutes on at least 1 day per week in the previous 4 weeks, as defined by their answers to Field 864
Coding 100291 defines 2 special values:
- -1 represents "Do not know"
- -3 represents "Prefer not to answer"
2 Related Data-Fields
| Field ID | Description | Relationship |
|---|
| 10953 | Duration of walks (pilot) | Field 10953 is the pilot-study predecessor of main-study Current Field |
| 864 | Number of days/week walked 10+ minutes | Current Field was collected from participants who indicated that they walked for 10 minutes on at least 1 day per week in the previous 4 weeks, as defined by their answers to Field 864 |
2 Applications
| Application ID | Title |
|---|
| 3173 | A multi-level approach to better understand the association between physical activity and sedentary behaviour, and cancer risk. |
| 4483 | Identification of modifiable and non-modifiable correlates of sedentary behaviours and physical activity in adults aged =65 years |


