Data
5,252 items of data are available, covering 4,757 participants.
Some values have special meanings defined by Data-Coding
100291.
Defined-instances run from 0 to 3, labelled using Instancing
2.
Units of measurement are years.
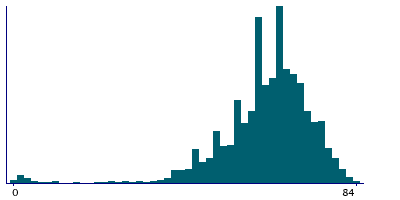
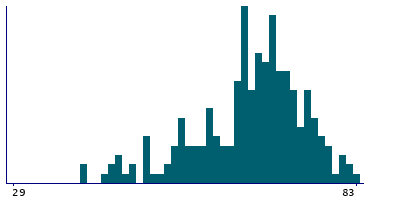
| Maximum | 87 |
| Decile 9 | 75 |
| Decile 8 | 71 |
| Decile 7 | 68 |
| Decile 6 | 66 |
| Median | 65 |
| Decile 4 | 62 |
| Decile 3 | 60 |
| Decile 2 | 55 |
| Decile 1 | 50 |
| Minimum | 0 |
|
|
- There are 79 distinct values.
- Mean = 62.5295
- Std.dev = 11.5843
- 71 items below graph minimum of 25
- 9 items have value -3 (Prefer not to answer)
- 365 items have value -1 (Do not know)
|
4 Instances
Instance 0 : Initial assessment visit (2006-2010) at which participants were recruited and consent given
1,314 participants, 1,314 items
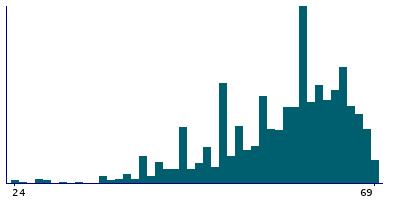
| Maximum | 69 |
| Decile 9 | 66 |
| Decile 8 | 64 |
| Decile 7 | 62 |
| Decile 6 | 60 |
| Median | 59 |
| Decile 4 | 57 |
| Decile 3 | 54 |
| Decile 2 | 50 |
| Decile 1 | 45 |
| Minimum | 0 |
|
|
- There are 55 distinct values.
- Mean = 56.242
- Std.dev = 10.7798
- 27 items below graph minimum of 24
- 2 items have value -3 (Prefer not to answer)
- 68 items have value -1 (Do not know)
|
Instance 1 : First repeat assessment visit (2012-13)
382 participants, 382 items
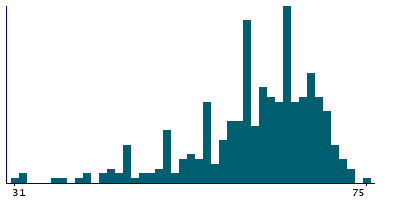
| Maximum | 75 |
| Decile 9 | 69 |
| Decile 8 | 67 |
| Decile 7 | 65 |
| Decile 6 | 64 |
| Median | 62 |
| Decile 4 | 60 |
| Decile 3 | 59 |
| Decile 2 | 55 |
| Decile 1 | 50 |
| Minimum | 1 |
|
|
- There are 43 distinct values.
- Mean = 60.4126
- Std.dev = 9.41524
- 4 items below graph minimum of 31
- 16 items have value -1 (Do not know)
|
Instance 2 : Imaging visit (2014+)
2,804 participants, 2,804 items
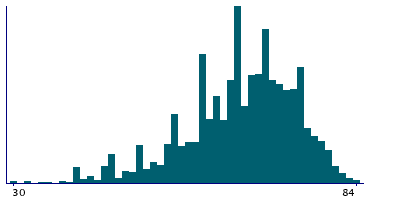
| Maximum | 84 |
| Decile 9 | 75 |
| Decile 8 | 73 |
| Decile 7 | 70 |
| Decile 6 | 69 |
| Median | 66 |
| Decile 4 | 65 |
| Decile 3 | 62 |
| Decile 2 | 59 |
| Decile 1 | 53 |
| Minimum | 1 |
|
|
- There are 64 distinct values.
- Mean = 64.8138
- Std.dev = 11.0524
- 38 items below graph minimum of 31
- 6 items have value -3 (Prefer not to answer)
- 226 items have value -1 (Do not know)
|
Instance 3 : First repeat imaging visit (2019+)
752 participants, 752 items
| Maximum | 87 |
| Decile 9 | 78 |
| Decile 8 | 75 |
| Decile 7 | 73 |
| Decile 6 | 70 |
| Median | 68 |
| Decile 4 | 65 |
| Decile 3 | 64 |
| Decile 2 | 60 |
| Decile 1 | 54 |
| Minimum | 0 |
|
|
- There are 52 distinct values.
- Mean = 66.4397
- Std.dev = 11.2793
- 8 items below graph minimum of 30
- 1 items have value -3 (Prefer not to answer)
- 55 items have value -1 (Do not know)
|
Notes
ACE touchscreen question "What was your age when macular degeneration was first diagnosed?"
The following checks were performed:
- If answer < 0 then rejected
- If answer > Participants age then rejected
- If answer < 40 then participant asked to confirm
- If answer > 69 then participant asked to confirm
If the participant activated the Help button they were shown the message:
If you are unsure, please provide an estimate or select Do not know.
|
Field 5923 was collected from participants who indicated they have macular degeneration, as defined by their answers to Field 6148
Coding 100291 defines 2 special values:
- -1 represents "Do not know"
- -3 represents "Prefer not to answer"
1 Related Data-Field
| Field ID | Description | Relationship |
|---|
| 6148 | Eye problems/disorders | Current Field was collected from participants who indicated they have macular degeneration, as defined by their answers to Field 6148 |
2 Applications
| Application ID | Title |
|---|
| 669 | Distribution and biological, environmental and lifestyle determinants of visual function and of refractive error in adults (aged 40 to 69 years) in the UK. |
| 17435 | Exploring the genetics of irritable bowel syndrome: the ?bellygenes? initiative (project approved by bbmri-lpc) |


