Data
640,889 items of data are available, covering 499,899 participants.
Defined-instances run from 0 to 3, labelled using Instancing
2.
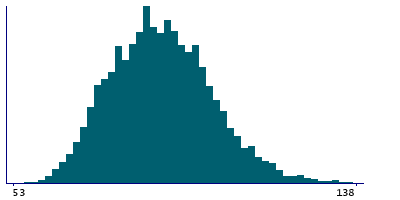
Units of measurement are cm.
| Maximum | 197 |
| Decile 9 | 107 |
| Decile 8 | 101 |
| Decile 7 | 97 |
| Decile 6 | 93 |
| Median | 90 |
| Decile 4 | 86 |
| Decile 3 | 83 |
| Decile 2 | 78 |
| Decile 1 | 73 |
| Minimum | 20 |
|
|
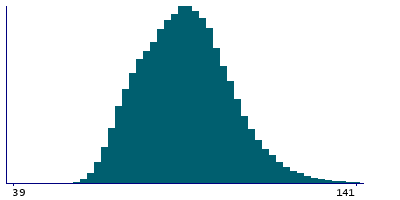
- Mean = 90.2276
- Std.dev = 13.3921
- 5 items below graph minimum of 39
- 714 items above graph maximum of 141
|
4 Instances
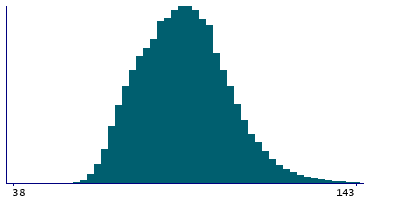
Instance 0 : Initial assessment visit (2006-2010) at which participants were recruited and consent given
499,777 participants, 499,777 items
| Maximum | 197 |
| Decile 9 | 108 |
| Decile 8 | 101 |
| Decile 7 | 97 |
| Decile 6 | 93 |
| Median | 90 |
| Decile 4 | 86 |
| Decile 3 | 83 |
| Decile 2 | 78 |
| Decile 1 | 73 |
| Minimum | 20 |
|
|
- Mean = 90.3139
- Std.dev = 13.486
- 4 items below graph minimum of 38
- 453 items above graph maximum of 143
|
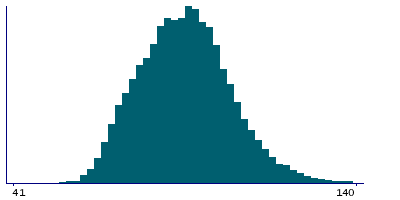
Instance 1 : First repeat assessment visit (2012-13)
20,300 participants, 20,300 items
| Maximum | 164 |
| Decile 9 | 107 |
| Decile 8 | 101 |
| Decile 7 | 97 |
| Decile 6 | 93 |
| Median | 90 |
| Decile 4 | 87 |
| Decile 3 | 83 |
| Decile 2 | 79 |
| Decile 1 | 74 |
| Minimum | 39 |
|
|
- Mean = 90.5679
- Std.dev = 13.2272
- 1 item below graph minimum of 41
- 31 items above graph maximum of 140
|
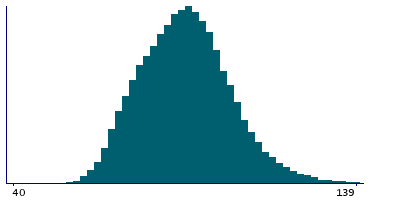
Instance 2 : Imaging visit (2014+)
99,990 participants, 99,990 items
| Maximum | 184 |
| Decile 9 | 106 |
| Decile 8 | 100 |
| Decile 7 | 96 |
| Decile 6 | 92 |
| Median | 89 |
| Decile 4 | 86 |
| Decile 3 | 82 |
| Decile 2 | 78 |
| Decile 1 | 73 |
| Minimum | 20 |
|
|
- Mean = 89.629
- Std.dev = 13.0661
- 1 item below graph minimum of 40
- 104 items above graph maximum of 139
|
Instance 3 : First repeat imaging visit (2019+)
20,822 participants, 20,822 items
| Maximum | 153 |
| Decile 9 | 107 |
| Decile 8 | 101 |
| Decile 7 | 97 |
| Decile 6 | 94 |
| Median | 90 |
| Decile 4 | 87 |
| Decile 3 | 84 |
| Decile 2 | 80 |
| Decile 1 | 74 |
| Minimum | 46 |
|
|
- Mean = 90.6982
- Std.dev = 12.7367
- 17 items above graph maximum of 140
|

