Data
158,209 items of data are available, covering 131,776 participants.
Some values have special meanings defined by Data-Coding
100291.
Defined-instances run from 0 to 3, labelled using Instancing
2.
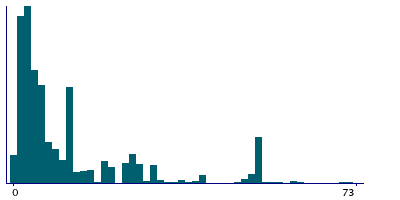
Units of measurement are weeks.
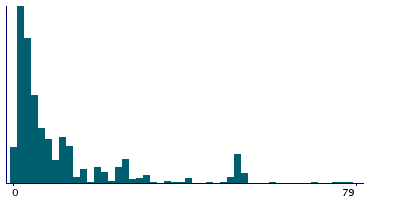
| Maximum | 999 |
| Decile 9 | 40 |
| Decile 8 | 20 |
| Decile 7 | 12 |
| Decile 6 | 8 |
| Median | 5 |
| Decile 4 | 4 |
| Decile 3 | 3 |
| Decile 2 | 2 |
| Decile 1 | 1 |
| Minimum | 1 |
|
|
- There are 210 distinct values.
- Mean = 16.1912
- Std.dev = 40.7083
- 4246 items above graph maximum of 79
- 2410 items have value -3 (Prefer not to answer)
- 28698 items have value -1 (Do not know)
|
4 Instances
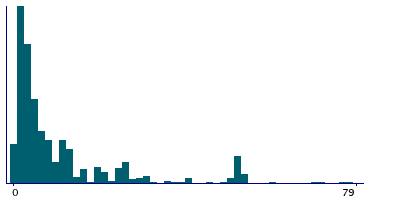
Instance 0 : Initial assessment visit (2006-2010) at which participants were recruited and consent given
89,271 participants, 89,271 items
| Maximum | 999 |
| Decile 9 | 40 |
| Decile 8 | 20 |
| Decile 7 | 12 |
| Decile 6 | 8 |
| Median | 5 |
| Decile 4 | 4 |
| Decile 3 | 3 |
| Decile 2 | 2 |
| Decile 1 | 1 |
| Minimum | 1 |
|
|
- There are 185 distinct values.
- Mean = 15.9326
- Std.dev = 41.6549
- 2345 items above graph maximum of 79
- 1433 items have value -3 (Prefer not to answer)
- 16150 items have value -1 (Do not know)
|
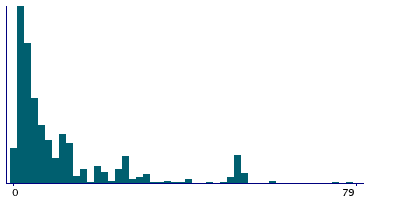
Instance 1 : First repeat assessment visit (2012-13)
10,098 participants, 10,098 items
| Maximum | 999 |
| Decile 9 | 40 |
| Decile 8 | 20 |
| Decile 7 | 12 |
| Decile 6 | 8 |
| Median | 6 |
| Decile 4 | 4 |
| Decile 3 | 3 |
| Decile 2 | 2 |
| Decile 1 | 1 |
| Minimum | 1 |
|
|
- There are 95 distinct values.
- Mean = 15.8049
- Std.dev = 37.3396
- 279 items above graph maximum of 79
- 116 items have value -3 (Prefer not to answer)
- 1858 items have value -1 (Do not know)
|
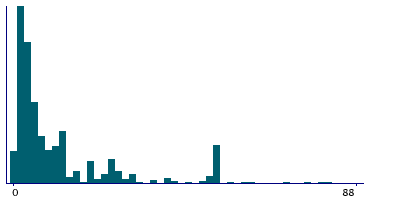
Instance 2 : Imaging visit (2014+)
49,089 participants, 49,089 items
| Maximum | 999 |
| Decile 9 | 50 |
| Decile 8 | 20 |
| Decile 7 | 12 |
| Decile 6 | 8 |
| Median | 6 |
| Decile 4 | 4 |
| Decile 3 | 3 |
| Decile 2 | 2 |
| Decile 1 | 2 |
| Minimum | 1 |
|
|
- There are 132 distinct values.
- Mean = 16.7024
- Std.dev = 39.9055
- 1301 items above graph maximum of 98
- 723 items have value -3 (Prefer not to answer)
- 8907 items have value -1 (Do not know)
|
Instance 3 : First repeat imaging visit (2019+)
9,751 participants, 9,751 items
| Maximum | 999 |
| Decile 9 | 40 |
| Decile 8 | 20 |
| Decile 7 | 12 |
| Decile 6 | 8 |
| Median | 6 |
| Decile 4 | 4 |
| Decile 3 | 3 |
| Decile 2 | 2 |
| Decile 1 | 2 |
| Minimum | 1 |
|
|
- There are 87 distinct values.
- Mean = 16.3831
- Std.dev = 39.2444
- 248 items above graph maximum of 78
- 138 items have value -3 (Prefer not to answer)
- 1783 items have value -1 (Do not know)
|
Notes
ACE touchscreen question "How many weeks was the longest period when you were feeling depressed or down?"
Question was introduced part way through fieldwork in April 2009.
The following checks were performed:
- If answer < 1 then rejected
- If answer > 999 then rejected
Field 4609 was collected from participants who indicated they have felt depressed or down for at least a whole week, as defined by their answers to Field 4598
Coding 100291 defines 2 special values:
- -1 represents "Do not know"
- -3 represents "Prefer not to answer"
1 Related Data-Field
| Field ID | Description | Relationship |
|---|
| 4598 | Ever depressed for a whole week | Current Field was collected from participants who indicated they have felt depressed or down for at least a whole week, as defined by their answers to Field 4598 |
6 Applications
| Application ID | Title |
|---|
| 1602 | Association between diet and depression |
| 17435 | Exploring the genetics of irritable bowel syndrome: the ?bellygenes? initiative (project approved by bbmri-lpc) |
| 31187 | Integrative Prioritization of Loci for Alcohol Use Disorders and Associated Complex Traits |
| 16577 | Investigations of the genetic overlap between internalising psychiatric disorders and co-morbid physical health disorders. |
| 14801 | Social isolation and health - what are the mechanisms? |
| 41686 | Understanding the biological, lifestyle and environmental risks and outcomes for multimorbidity in psychiatric disorders |


