Data
72,817 items of data are available, covering 62,902 participants.
Some values have special meanings defined by Data-Coding
100291.
Defined-instances run from 0 to 3, labelled using Instancing
2.
Units of measurement are glasses.
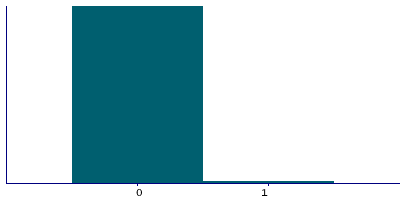
| Maximum | 23 |
| Decile 9 | 0 |
| Decile 8 | 0 |
| Decile 7 | 0 |
| Decile 6 | 0 |
| Median | 0 |
| Decile 4 | 0 |
| Decile 3 | 0 |
| Decile 2 | 0 |
| Decile 1 | 0 |
| Minimum | 0 |
|

|
- There are 15 distinct values.
- Mean = 0.0818767
- Std.dev = 0.541316
- 1464 items above graph maximum of 1
- 91 items have value -3 (Prefer not to answer)
- 300 items have value -1 (Do not know)
|
4 Instances
Instance 0 : Initial assessment visit (2006-2010) at which participants were recruited and consent given
40,788 participants, 40,788 items
| Maximum | 23 |
| Decile 9 | 0 |
| Decile 8 | 0 |
| Decile 7 | 0 |
| Decile 6 | 0 |
| Median | 0 |
| Decile 4 | 0 |
| Decile 3 | 0 |
| Decile 2 | 0 |
| Decile 1 | 0 |
| Minimum | 0 |
|

|
- There are 15 distinct values.
- Mean = 0.109537
- Std.dev = 0.643515
- 1089 items above graph maximum of 1
- 81 items have value -3 (Prefer not to answer)
- 255 items have value -1 (Do not know)
|
Instance 1 : First repeat assessment visit (2012-13)
4,453 participants, 4,453 items
| Maximum | 8 |
| Decile 9 | 0 |
| Decile 8 | 0 |
| Decile 7 | 0 |
| Decile 6 | 0 |
| Median | 0 |
| Decile 4 | 0 |
| Decile 3 | 0 |
| Decile 2 | 0 |
| Decile 1 | 0 |
| Minimum | 0 |
|

|
- There are 7 distinct values.
- Mean = 0.0514954
- Std.dev = 0.376152
- 60 items above graph maximum of 1
- 6 items have value -1 (Do not know)
|
Instance 2 : Imaging visit (2014+)
22,749 participants, 22,749 items
| Maximum | 10 |
| Decile 9 | 0 |
| Decile 8 | 0 |
| Decile 7 | 0 |
| Decile 6 | 0 |
| Median | 0 |
| Decile 4 | 0 |
| Decile 3 | 0 |
| Decile 2 | 0 |
| Decile 1 | 0 |
| Minimum | 0 |
|

|
- There are 9 distinct values.
- Mean = 0.0470759
- Std.dev = 0.378818
- 264 items above graph maximum of 1
- 9 items have value -3 (Prefer not to answer)
- 32 items have value -1 (Do not know)
|
Instance 3 : First repeat imaging visit (2019+)
4,827 participants, 4,827 items
| Maximum | 6 |
| Decile 9 | 0 |
| Decile 8 | 0 |
| Decile 7 | 0 |
| Decile 6 | 0 |
| Median | 0 |
| Decile 4 | 0 |
| Decile 3 | 0 |
| Decile 2 | 0 |
| Decile 1 | 0 |
| Minimum | 0 |
|
|
- There are 7 distinct values.
- Mean = 0.0417099
- Std.dev = 0.32615
- 51 items above graph maximum of 1
- 1 items have value -3 (Prefer not to answer)
- 7 items have value -1 (Do not know)
|
Notes
ACE touchscreen question "In an average MONTH, how many glasses of other alcoholic drinks (such as alcopops) would you drink?"
The following checks were performed:
- If answer < 0 then rejected
Field 4462 was collected from participants who indicated they drink alcohol on special occasions or one to three times a month, as defined by their answers to Field 1558
Coding 100291 defines 2 special values:
- -1 represents "Do not know"
- -3 represents "Prefer not to answer"


