Data
307,740 items of data are available, covering 241,992 participants.
Defined-instances run from 0 to 3, labelled using Instancing
2.
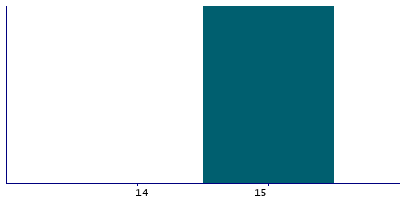
| Maximum | 15 |
| Decile 9 | 15 |
| Decile 8 | 15 |
| Decile 7 | 15 |
| Decile 6 | 15 |
| Median | 15 |
| Decile 4 | 15 |
| Decile 3 | 15 |
| Decile 2 | 15 |
| Decile 1 | 15 |
| Minimum | 0 |
|

|
- There are 16 distinct values.
- Mean = 14.7242
- Std.dev = 1.88567
- 6788 items below graph minimum of 14
|
4 Instances
Instance 0 : Initial assessment visit (2006-2010) at which participants were recruited and consent given
167,863 participants, 167,863 items
| Maximum | 15 |
| Decile 9 | 15 |
| Decile 8 | 15 |
| Decile 7 | 15 |
| Decile 6 | 15 |
| Median | 15 |
| Decile 4 | 15 |
| Decile 3 | 15 |
| Decile 2 | 15 |
| Decile 1 | 15 |
| Minimum | 0 |
|
|
- There are 16 distinct values.
- Mean = 14.6523
- Std.dev = 2.11189
- 4668 items below graph minimum of 14
|
Instance 1 : First repeat assessment visit (2012-13)
20,042 participants, 20,042 items
| Maximum | 15 |
| Decile 9 | 15 |
| Decile 8 | 15 |
| Decile 7 | 15 |
| Decile 6 | 15 |
| Median | 15 |
| Decile 4 | 15 |
| Decile 3 | 15 |
| Decile 2 | 15 |
| Decile 1 | 15 |
| Minimum | 0 |
|

|
- There are 16 distinct values.
- Mean = 14.8694
- Std.dev = 1.28613
- 215 items below graph minimum of 14
|
Instance 2 : Imaging visit (2014+)
99,220 participants, 99,220 items
| Maximum | 15 |
| Decile 9 | 15 |
| Decile 8 | 15 |
| Decile 7 | 15 |
| Decile 6 | 15 |
| Median | 15 |
| Decile 4 | 15 |
| Decile 3 | 15 |
| Decile 2 | 15 |
| Decile 1 | 15 |
| Minimum | 0 |
|

|
- There are 16 distinct values.
- Mean = 14.7831
- Std.dev = 1.68321
- 1704 items below graph minimum of 14
|
Instance 3 : First repeat imaging visit (2019+)
20,615 participants, 20,615 items
| Maximum | 15 |
| Decile 9 | 15 |
| Decile 8 | 15 |
| Decile 7 | 15 |
| Decile 6 | 15 |
| Median | 15 |
| Decile 4 | 15 |
| Decile 3 | 15 |
| Decile 2 | 15 |
| Decile 1 | 15 |
| Minimum | 0 |
|

|
- There are 15 distinct values.
- Mean = 14.8855
- Std.dev = 1.18881
- 201 items below graph minimum of 14
|


