Data
4,531,240 items of data are available, covering 240,345 participants.
Defined-instances run from 0 to 3, labelled using Instancing
2.
Array indices run from 1 to 15.
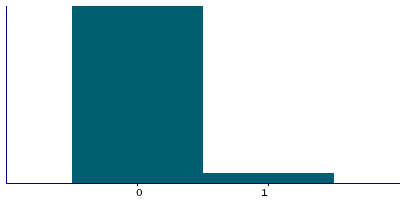
| Maximum | 74 |
| Decile 9 | 0 |
| Decile 8 | 0 |
| Decile 7 | 0 |
| Decile 6 | 0 |
| Median | 0 |
| Decile 4 | 0 |
| Decile 3 | 0 |
| Decile 2 | 0 |
| Decile 1 | 0 |
| Minimum | 0 |
|
|
- There are 42 distinct values.
- Mean = 0.0948487
- Std.dev = 0.465507
- 67284 items above graph maximum of 1
|
4 Instances
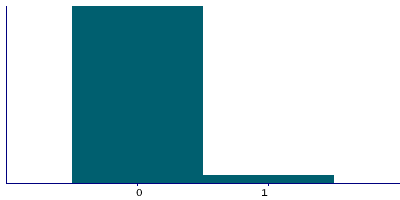
Instance 0 : Initial assessment visit (2006-2010) at which participants were recruited and consent given
166,165 participants, 2,459,584 items
| Maximum | 58 |
| Decile 9 | 0 |
| Decile 8 | 0 |
| Decile 7 | 0 |
| Decile 6 | 0 |
| Median | 0 |
| Decile 4 | 0 |
| Decile 3 | 0 |
| Decile 2 | 0 |
| Decile 1 | 0 |
| Minimum | 0 |
|
|
- There are 39 distinct values.
- Mean = 0.0873013
- Std.dev = 0.491178
- 38443 items above graph maximum of 1
|
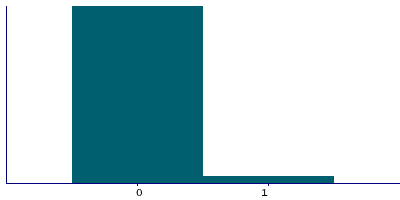
Instance 1 : First repeat assessment visit (2012-13)
20,011 participants, 298,012 items
| Maximum | 74 |
| Decile 9 | 0 |
| Decile 8 | 0 |
| Decile 7 | 0 |
| Decile 6 | 0 |
| Median | 0 |
| Decile 4 | 0 |
| Decile 3 | 0 |
| Decile 2 | 0 |
| Decile 1 | 0 |
| Minimum | 0 |
|
|
- There are 23 distinct values.
- Mean = 0.0728393
- Std.dev = 0.433588
- 3671 items above graph maximum of 1
|
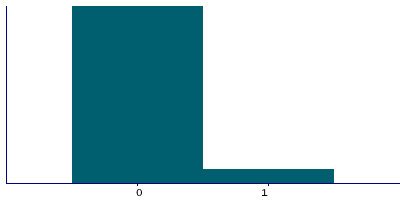
Instance 2 : Imaging visit (2014+)
98,811 participants, 1,466,780 items
| Maximum | 33 |
| Decile 9 | 0 |
| Decile 8 | 0 |
| Decile 7 | 0 |
| Decile 6 | 0 |
| Median | 0 |
| Decile 4 | 0 |
| Decile 3 | 0 |
| Decile 2 | 0 |
| Decile 1 | 0 |
| Minimum | 0 |
|
|
- There are 27 distinct values.
- Mean = 0.110228
- Std.dev = 0.436895
- 21148 items above graph maximum of 1
|
Instance 3 : First repeat imaging visit (2019+)
20,574 participants, 306,864 items
| Maximum | 19 |
| Decile 9 | 0 |
| Decile 8 | 0 |
| Decile 7 | 0 |
| Decile 6 | 0 |
| Median | 0 |
| Decile 4 | 0 |
| Decile 3 | 0 |
| Decile 2 | 0 |
| Decile 1 | 0 |
| Minimum | 0 |
|

|
- There are 20 distinct values.
- Mean = 0.103205
- Std.dev = 0.411102
- 4022 items above graph maximum of 1
|


