Data
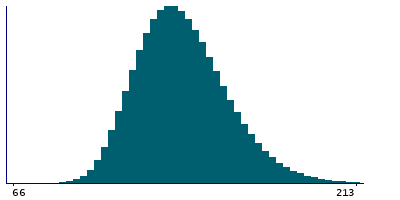
1,155,218 items of data are available, covering 476,030 participants.
Defined-instances run from 0 to 3, labelled using Instancing
2.
Array indices run from 0 to 1.
Units of measurement are mmHg.
| Maximum | 268 |
| Decile 9 | 164 |
| Decile 8 | 154 |
| Decile 7 | 147 |
| Decile 6 | 142 |
| Median | 137 |
| Decile 4 | 132 |
| Decile 3 | 127 |
| Decile 2 | 122 |
| Decile 1 | 115 |
| Minimum | 51 |
|
|
- There are 197 distinct values.
- Mean = 138.594
- Std.dev = 19.5271
- 6 items below graph minimum of 66
- 1330 items above graph maximum of 213
|
4 Instances
Instance 0 : Initial assessment visit (2006-2010) at which participants were recruited and consent given
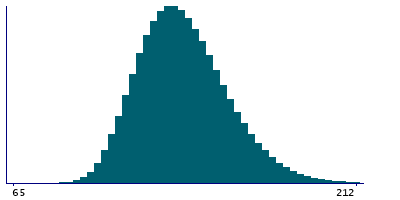
471,849 participants, 928,287 items
| Maximum | 268 |
| Decile 9 | 163 |
| Decile 8 | 153 |
| Decile 7 | 147 |
| Decile 6 | 141 |
| Median | 136 |
| Decile 4 | 131 |
| Decile 3 | 127 |
| Decile 2 | 121 |
| Decile 1 | 114 |
| Minimum | 56 |
|
|
- There are 194 distinct values.
- Mean = 137.805
- Std.dev = 19.2936
- 3 items below graph minimum of 65
- 1046 items above graph maximum of 212
|
Instance 1 : First repeat assessment visit (2012-13)
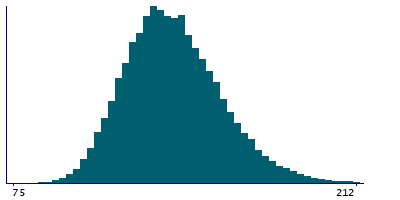
20,266 participants, 40,346 items
| Maximum | 240 |
| Decile 9 | 164 |
| Decile 8 | 154 |
| Decile 7 | 148 |
| Decile 6 | 142 |
| Median | 137 |
| Decile 4 | 133 |
| Decile 3 | 128 |
| Decile 2 | 123 |
| Decile 1 | 116 |
| Minimum | 75 |
|
|
- There are 151 distinct values.
- Mean = 138.873
- Std.dev = 19.248
- 47 items above graph maximum of 212
|
Instance 2 : Imaging visit (2014+)
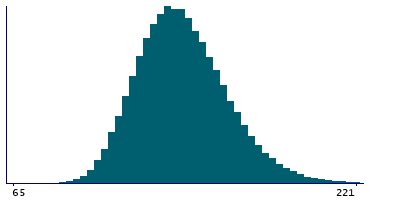
82,715 participants, 160,164 items
| Maximum | 252 |
| Decile 9 | 169 |
| Decile 8 | 159 |
| Decile 7 | 152 |
| Decile 6 | 146 |
| Median | 141 |
| Decile 4 | 136 |
| Decile 3 | 131 |
| Decile 2 | 125 |
| Decile 1 | 118 |
| Minimum | 51 |
|
|
- There are 174 distinct values.
- Mean = 142.319
- Std.dev = 20.3158
- 2 items below graph minimum of 67
- 151 items above graph maximum of 220
|
Instance 3 : First repeat imaging visit (2019+)
13,539 participants, 26,421 items
| Maximum | 243 |
| Decile 9 | 170 |
| Decile 8 | 159 |
| Decile 7 | 153 |
| Decile 6 | 147 |
| Median | 142 |
| Decile 4 | 137 |
| Decile 3 | 132 |
| Decile 2 | 126 |
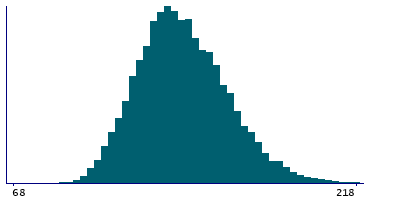
| Decile 1 | 119 |
| Minimum | 58 |
|
|
- There are 156 distinct values.
- Mean = 143.305
- Std.dev = 19.9409
- 1 item below graph minimum of 68
- 23 items above graph maximum of 221
|
Notes
Blood pressure, automated reading, systolic. Two measures of blood pressure were taken a few moments apart.
Range returned by the Omron device is is 0-255


