Data
489,797 items of data are available, covering 489,797 participants.
Defined-instances run from 0 to 3, labelled using Instancing
2.
Units of measurement are ng/micro-l.
| Maximum | 387.2 |
| Decile 9 | 19.3 |
| Decile 8 | 14.3 |
| Decile 7 | 13.3 |
| Decile 6 | 12.666 |
| Median | 12.1 |
| Decile 4 | 11.6 |
| Decile 3 | 11.1 |
| Decile 2 | 10.5 |
| Decile 1 | 9.661 |
| Minimum | -4.4 |
|
|
- Mean = 13.6263
- Std.dev = 6.67226
- 9 items below graph minimum of 0
- 15206 items above graph maximum of 28.939
|
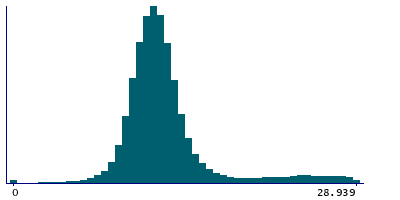
4 Instances
Instance 0 : Initial assessment visit (2006-2010) at which participants were recruited and consent given
487,772 participants, 487,772 items
| Maximum | 387.2 |
| Decile 9 | 19.1085 |
| Decile 8 | 14.3 |
| Decile 7 | 13.3 |
| Decile 6 | 12.655 |
| Median | 12.1 |
| Decile 4 | 11.6 |
| Decile 3 | 11.1 |
| Decile 2 | 10.5 |
| Decile 1 | 9.66 |
| Minimum | -4.4 |
|

|
- Mean = 13.6105
- Std.dev = 6.64261
- 9 items below graph minimum of 0
- 16230 items above graph maximum of 28.557
|
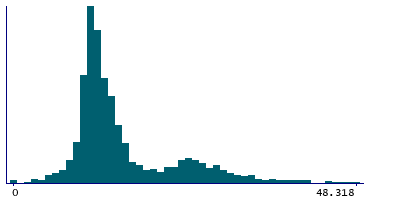
Instance 1 : First repeat assessment visit (2012-13)
1,361 participants, 1,361 items
| Maximum | 135.2 |
| Decile 9 | 28.959 |
| Decile 8 | 23.369 |
| Decile 7 | 16.145 |
| Decile 6 | 13.9665 |
| Median | 12.715 |
| Decile 4 | 11.8245 |
| Decile 3 | 11.1 |
| Decile 2 | 10.504 |
| Decile 1 | 9.6 |
| Minimum | 0 |
|
|
- Mean = 17.2109
- Std.dev = 13.1254
- 42 items above graph maximum of 48.318
|
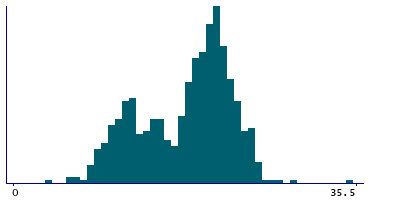
Instance 2 : Imaging visit (2014+)
638 participants, 638 items
| Maximum | 63.091 |
| Decile 9 | 23.1 |
| Decile 8 | 21.8 |
| Decile 7 | 20.95 |
| Decile 6 | 20.1 |
| Median | 19 |
| Decile 4 | 17.7 |
| Decile 3 | 15 |
| Decile 2 | 12.5 |
| Decile 1 | 10.7 |
| Minimum | 3.9 |
|
|
- Mean = 17.8847
- Std.dev = 5.28978
- 2 items above graph maximum of 35.5
|
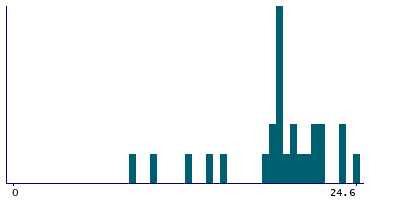
Instance 3 : First repeat imaging visit (2019+)
26 participants, 26 items
| Maximum | 24.6 |
| Decile 9 | 23.7 |
| Decile 8 | 22.05 |
| Decile 7 | 21.75 |
| Decile 6 | 20.65 |
| Median | 19.4 |
| Decile 4 | 19.1 |
| Decile 3 | 18.95 |
| Decile 2 | 18.85 |
| Decile 1 | 14.55 |
| Minimum | 8.5 |
|
|
- Mean = 19.4654
- Std.dev = 3.55906
|
Notes
Sample concentration as measured by sequencing providers.
0 Related Data-Fields
There are no related data-fields
0 Resources
There are no matching Resources
