Data
1,414,645 items of data are available, covering 457,010 participants.
Defined-instances run from 0 to 3, labelled using Instancing
2.
Array indices run from 0 to 2.
Units of measurement are litres.
| Maximum | 32.77 |
| Decile 9 | 4.96 |
| Decile 8 | 4.45 |
| Decile 7 | 4.07 |
| Decile 6 | 3.76 |
| Median | 3.48 |
| Decile 4 | 3.24 |
| Decile 3 | 3 |
| Decile 2 | 2.75 |
| Decile 1 | 2.41 |
| Minimum | 0.01 |
|
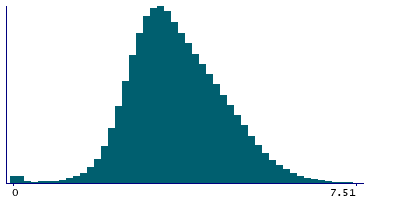
|
- Mean = 3.58816
- Std.dev = 1.07801
- 1552 items above graph maximum of 7.51
|
4 Instances
Instance 0 : Initial assessment visit (2006-2010) at which participants were recruited and consent given
453,186 participants, 1,239,673 items
| Maximum | 32.77 |
| Decile 9 | 4.98 |
| Decile 8 | 4.46 |
| Decile 7 | 4.08 |
| Decile 6 | 3.77 |
| Median | 3.49 |
| Decile 4 | 3.25 |
| Decile 3 | 3.01 |
| Decile 2 | 2.76 |
| Decile 1 | 2.41 |
| Minimum | 0.01 |
|
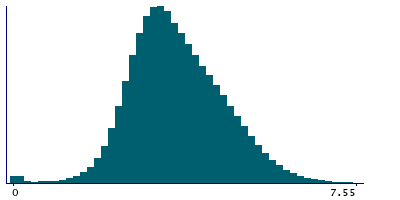
|
- Mean = 3.59915
- Std.dev = 1.08283
- 1366 items above graph maximum of 7.55
|
Instance 1 : First repeat assessment visit (2012-13)
18,084 participants, 49,529 items
| Maximum | 14.89 |
| Decile 9 | 4.85 |
| Decile 8 | 4.37 |
| Decile 7 | 4.01 |
| Decile 6 | 3.7 |
| Median | 3.43 |
| Decile 4 | 3.19 |
| Decile 3 | 2.95 |
| Decile 2 | 2.7 |
| Decile 1 | 2.37 |
| Minimum | 0.02 |
|
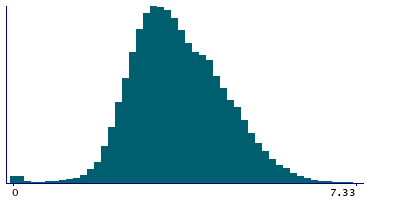
|
- Mean = 3.52116
- Std.dev = 1.00699
- 41 items above graph maximum of 7.33
|
Instance 2 : Imaging visit (2014+)
43,071 participants, 117,634 items
| Maximum | 32.77 |
| Decile 9 | 4.8 |
| Decile 8 | 4.32 |
| Decile 7 | 3.97 |
| Decile 6 | 3.67 |
| Median | 3.41 |
| Decile 4 | 3.17 |
| Decile 3 | 2.94 |
| Decile 2 | 2.69 |
| Decile 1 | 2.38 |
| Minimum | 0.01 |
|
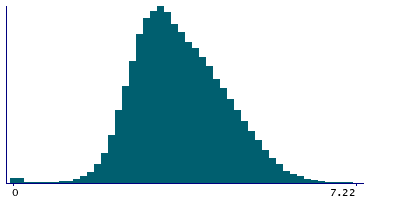
|
- Mean = 3.50671
- Std.dev = 1.05691
- 99 items above graph maximum of 7.22
|
Instance 3 : First repeat imaging visit (2019+)
2,912 participants, 7,809 items
| Maximum | 22.78 |
| Decile 9 | 4.75 |
| Decile 8 | 4.3 |
| Decile 7 | 3.96 |
| Decile 6 | 3.67 |
| Median | 3.4 |
| Decile 4 | 3.16 |
| Decile 3 | 2.94 |
| Decile 2 | 2.69 |
| Decile 1 | 2.4 |
| Minimum | 0.02 |
|
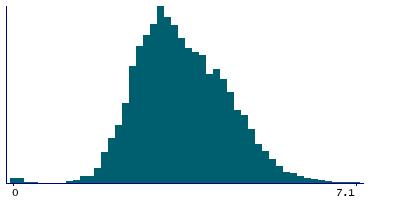
|
- Mean = 3.49531
- Std.dev = 0.984679
- 6 items above graph maximum of 7.1
|


