Data
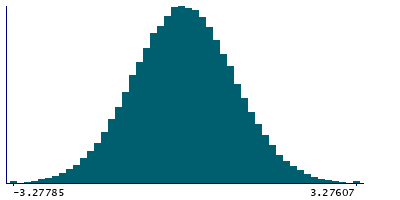
62,648 items of data are available, covering 62,648 participants.
Defined-instances run from 0 to 1, labelled using Instancing
2.
Units of measurement are mm.
| Maximum | 3.27607 |
| Decile 9 | 1.20607 |
| Decile 8 | 0.782599 |
| Decile 7 | 0.477681 |
| Decile 6 | 0.217168 |
| Median | -0.0268408 |
| Decile 4 | -0.269959 |
| Decile 3 | -0.534539 |
| Decile 2 | -0.836812 |
| Decile 1 | -1.25864 |
| Minimum | -3.27785 |
|
|
- Mean = -0.027839
- Std.dev = 0.961641
- 1 item above graph maximum of 3.27607
|
2 Instances
Instance 0 : Initial assessment visit (2006-2010) at which participants were recruited and consent given
49,348 participants, 49,348 items
| Maximum | 3.27607 |
| Decile 9 | 1.19039 |
| Decile 8 | 0.771704 |
| Decile 7 | 0.468809 |
| Decile 6 | 0.211118 |
| Median | -0.0311267 |
| Decile 4 | -0.272415 |
| Decile 3 | -0.53378 |
| Decile 2 | -0.834358 |
| Decile 1 | -1.2508 |
| Minimum | -3.27785 |
|

|
- Mean = -0.0319042
- Std.dev = 0.95305
- 1 item above graph maximum of 3.27607
|
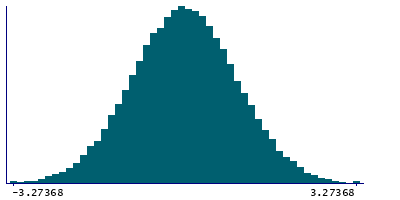
Instance 1 : First repeat assessment visit (2012-13)
13,300 participants, 13,300 items
| Maximum | 3.27368 |
| Decile 9 | 1.26812 |
| Decile 8 | 0.823932 |
| Decile 7 | 0.506435 |
| Decile 6 | 0.241445 |
| Median | -0.0111284 |
| Decile 4 | -0.263803 |
| Decile 3 | -0.540845 |
| Decile 2 | -0.849005 |
| Decile 1 | -1.29174 |
| Minimum | -3.27368 |
|
|
- Mean = -0.0127559
- Std.dev = 0.992723
|

