Data
83,909 items of data are available, covering 79,382 participants.
Defined-instances run from 2 to 3, labelled using Instancing
2.
Units of measurement are AU.
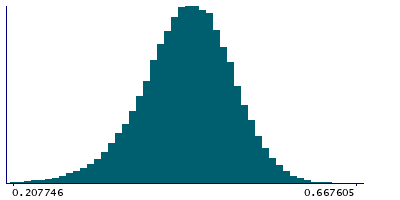
| Maximum | 0.692591 |
| Decile 9 | 0.515419 |
| Decile 8 | 0.491543 |
| Decile 7 | 0.473743 |
| Decile 6 | 0.458382 |
| Median | 0.443455 |
| Decile 4 | 0.428449 |
| Decile 3 | 0.41183 |
| Decile 2 | 0.392052 |
| Decile 1 | 0.361655 |
| Minimum | -0.0427824 |
|
|
- Mean = 0.440272
- Std.dev = 0.0620839
- 149 items below graph minimum of 0.207892
- 1 item above graph maximum of 0.669182
|
2 Instances
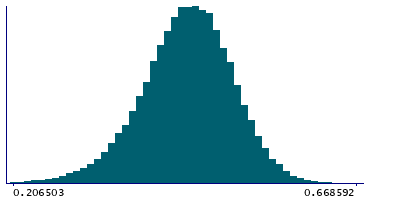
Instance 2 : Imaging visit (2014+)
79,151 participants, 79,151 items
| Maximum | 0.692591 |
| Decile 9 | 0.515639 |
| Decile 8 | 0.491755 |
| Decile 7 | 0.473911 |
| Decile 6 | 0.458513 |
| Median | 0.443521 |
| Decile 4 | 0.428461 |
| Decile 3 | 0.411773 |
| Decile 2 | 0.391869 |
| Decile 1 | 0.361283 |
| Minimum | -0.0427824 |
|
|
- Mean = 0.440284
- Std.dev = 0.0623027
- 139 items below graph minimum of 0.206928
- 1 item above graph maximum of 0.669995
|
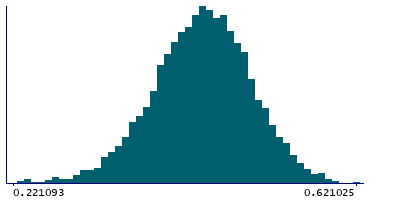
Instance 3 : First repeat imaging visit (2019+)
4,758 participants, 4,758 items
| Maximum | 0.621025 |
| Decile 9 | 0.511896 |
| Decile 8 | 0.488519 |
| Decile 7 | 0.471188 |
| Decile 6 | 0.456525 |
| Median | 0.442902 |
| Decile 4 | 0.428086 |
| Decile 3 | 0.412252 |
| Decile 2 | 0.394108 |
| Decile 1 | 0.36651 |
| Minimum | 0 |
|
|
- Mean = 0.440084
- Std.dev = 0.0583221
- 7 items below graph minimum of 0.221123
|
Notes
Weighted-mean MO (diffusion tensor mode) in tract right parahippocampal part of cingulum (from dMRI data)
0 Related Data-Fields
There are no related data-fields
2 Applications
| Application ID | Title |
|---|
| 17689 | Genetic, environmental and lifestyle predictors of brain/cognitive-related outcomes. |
| 22783 | The joint analysis of imaging data and genetic data for early tumor detection, prevention, diagnosis and treatment |

